


![]()
Kubernetes auditing an important source of information to include in your Kubernetes security plan as Kubernetes adoption grows. It provides full insight into all activities occurring within the cluster to security and DevOps teams.
In Kubernetes 1.11, the audit logging capability was introduced. The audit logs capture events like launching a new deployment, deleting namespaces, starting a node port service, and so on, making it a crucial component in safeguarding your Kubernetes cluster. In this blog, we will be learning what Kubernetes auditing is.
In this blog we will learn:
What is Auditing?
Kubernetes auditing creates a chronological set of records that document the course of events in a cluster. Users, applications that use the Kubernetes API, and the control plane itself all generate activities that are audited by the cluster.
Cluster administrators can use auditing to answer the following questions:
- what happened?
- when did it happen?
- who initiated it?
- on what did it happen?
- where was it observed?
- from where was it initiated?
- to where was it going?
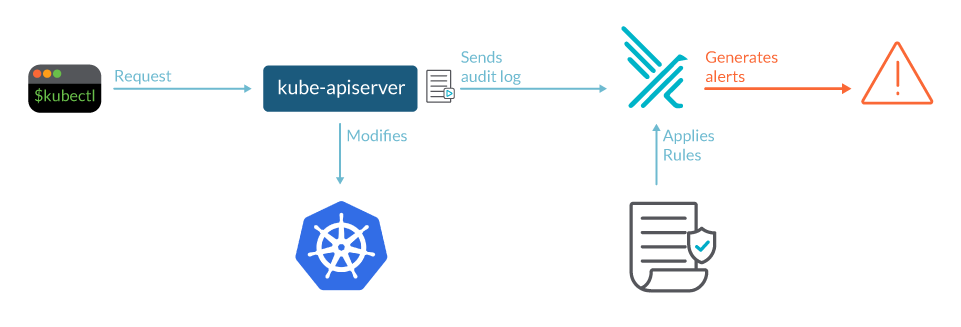 Source: Sysdig
The kube-apiserver component is where audit records begin their lifecycle. Each request generates an audit event at each level of execution, which is subsequently pre-processed according to a policy and written to a backend. What is recorded is determined by the policy, and the records are kept by the backends. Log files and webhooks are two of the existing backend implementations.
Each request can be assigned to a specific stage. The stages are as follows:
RequestReceived: This is the stage for events that occur after the audit handler receives the request and before it is passed down the handler chain.
ResponseStarted: When the response headers have been sent but the response body has not yet been sent. This stage is only created for requests that take a long time to complete (e.g. watch).
ResponseComplete: There will be no further bytes transferred after the response body has been completed.
Panic: Events generated when a panic occurred.
Kubernetes audit policy
The audit policy establishes guidelines for what events should be recorded and what information should be included. The audit.k8s.io API group defines the audit policy object structure. When an event is processed, it is compared to a list of rules in chronological sequence. The first matching rule determines the event’s audit level.
The defined audit levels are:
- None: Events that match this criterion should not be logged.
- Metadata: Request metadata is logged, but not the request or answer body (requesting user, timestamp, resource, verb, etc.).
- Request: Event information and request body are logged, but the response body is not. This does not apply to requests that aren’t related to resources.
- RequestResponse: event metadata, request and response bodies should all be recorded. This does not apply to requests that aren’t related to resources.
The –audit-policy-file switch can be used to pass a file containing the policy to kube-apiserver. No events are logged if the flag is not set. The rules field in the audit policy file must be filled out. A policy that has no (0) regulations is considered illegal.
Such a policy would look like:
<code class="language-yaml" data-lang="yaml">apiVersion: audit.k8s.io/v1 # This is required.
kind: Policy
# Don't generate audit events for all requests in RequestReceived stage.
omitStages:
  - "RequestReceived"
rules:
  # Log pod changes at RequestResponse level
  - level: RequestResponse
    resources:
    - group: ""
      # Resource "pods" doesn't match requests to any subresource of pods,
      # which is consistent with the RBAC policy.
      resources: ["pods"]
  # Log "pods/log", "pods/status" at Metadata level
  - level: Metadata
    resources:
    - group: ""
      resources: ["pods/log", "pods/status"]

  # Don't log requests to a configmap called "controller-leader"
  - level: None
    resources:
    - group: ""
      resources: ["configmaps"]
      resourceNames: ["controller-leader"]

  # Don't log watch requests by the "system:kube-proxy" on endpoints or services
  - level: None
    users: ["system:kube-proxy"]
    verbs: ["watch"]
    resources:
    - group: "" # core API group
      resources: ["endpoints", "services"]

  # Don't log authenticated requests to certain non-resource URL paths.
  - level: None
    userGroups: ["system:authenticated"]
    nonResourceURLs:
    - "/api*" # Wildcard matching.
    - "/version"

  # Log the request body of configmap changes in kube-system.
  - level: Request
    resources:
    - group: "" # core API group
      resources: ["configmaps"]
    # This rule only applies to resources in the "kube-system" namespace.
    # The empty string "" can be used to select non-namespaced resources.
    namespaces: ["kube-system"]

  # Log configmap and secret changes in all other namespaces at the Metadata level.
  - level: Metadata
    resources:
    - group: "" # core API group
      resources: ["secrets", "configmaps"]

  # Log all other resources in core and extensions at the Request level.
  - level: Request
    resources:
    - group: "" # core API group
    - group: "extensions" # Version of group should NOT be included.

  # A catch-all rule to log all other requests at the Metadata level.
  - level: Metadata
    # Long-running requests like watches that fall under this rule will not
    # generate an audit event in RequestReceived.
    omitStages:
      - "RequestReceived"
You can configure multiple audit rules in a single Kubernetes audit Policy, as you can see above.
The fields that define each audit rule are:
- level: The audit level describing the event’s verbosity.
- resources: The audited object (for example, “ConfigMaps”).
- nonResourcesURL: A non-resource Uniform Resource Locator (URL) path that isn’t linked to anything.
- namespace: The audited objects are contained within a namespace.
- verb: Specific operation for audit – create, update, delete.
- users: The logged-in user to whom the rule applies.
- userGroups: The rule applies to an authenticated user group.
- omitStages: Prevents events from being generated on specific stages.
- Audit backends
If the logs are just sitting there, waiting for a forensic analysis, you won’t be able to respond to threats in a timely manner. Integration with a security instrument, such as a Host Intrusion Detection System (HIDS), unlocks the audit log’s full capabilities.
Audit backends save audit events to a remote location. The kube-apiserver comes with two backends out of the box:
- Log backend: The events are written to the filesystem. If your security software is installed on the same computer as the files, it can parse them. You may also use a json parser like jq to manually process the files and create some queries.
- Webhook backend: Sends events to a third-party HTTP API. Then your security tool doesn’t need access to the filesystem, and you may defend several kube-apiservers with a single security tool instance.
The Kubernetes API in the audit.k8s.io API group defines a structure for audit events.
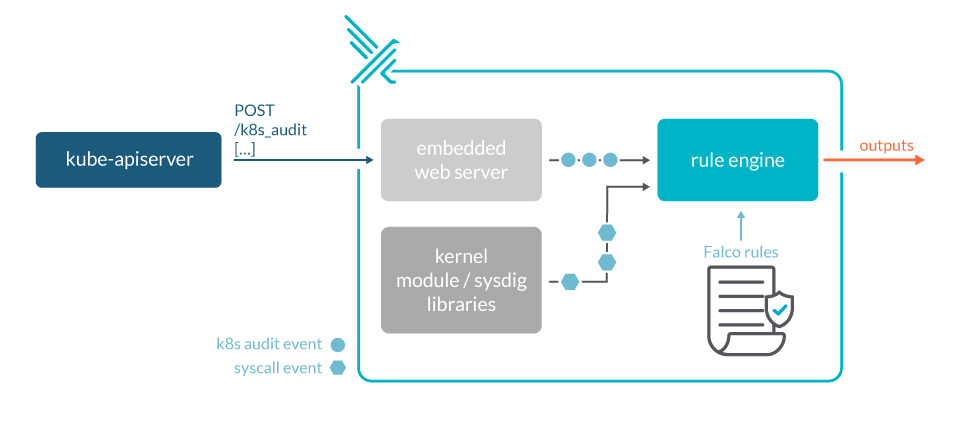
(Fig: Kubernetes audit logs with Falco)
Source: Sysdig
Event batching
Batching is supported by both the log and webhook backends. Here’s a list of available flags using webhook as an example. Replace webhook with log in the flag name to receive the same flag for the log backend. Batching is enabled by default in webhooks but disabled in logs. Throttling is also enabled by default in webhooks but disabled in logs.
Parameter tuning
The API server’s parameters should be configured to accommodate the load.
For example, if kube-apiserver receives 100 requests per second and only audits each request at the ResponseStarted and ResponseComplete stages, you can expect 200 audit events per second. If a batch contains up to 100 events, the throttling level should be set to at least 2 queries per second. Assuming that the backend can write events in up to 5 seconds, the buffer size should be set to hold up to 5 seconds of events, or 10 batches or 1000 events.
However, in most circumstances, the default options should suffice, and you won’t need to change them manually. To keep an eye on the condition of the auditing subsystem, look at the Prometheus metrics exposed by kube-apiserver and the logs.
- apiserver_audit_event_total metric contains the total number of audit events exported.
- apiserver_audit_error_total metric contains the total number of events dropped due to an error during exporting.
Conclusion
To strengthen your Kubernetes security approach, keep an eye out for new features and upgrades, and incorporate those that will allow you to see suspicious events or misconfigurations, such as Kubernetes audit log events.
The data collected in these logs can be quite useful in understanding what’s going on in our cluster, and it may even be necessary for compliance reasons.
Related/References
- Visit our YouTube channel “K21Academy”
- Certified Kubernetes Administrator (CKA) Certification Exam
- (CKA) Certification: Step By Step Activity Guides/Hands-On Lab Exercise & Learning Path
- Certified Kubernetes Application Developer (CKAD) Certification Exam
- (CKAD) Certification: Step By Step Activity Guides/Hands-On Lab Exercise & Learning Path
- Create AKS Cluster: A Complete Step-by-Step Guide
- Container (Docker) vs Virtual Machines (VM): What Is The Difference?
- How To Setup A Three Node Kubernetes Cluster For CKA: Step By Step
Join FREE Masterclass
To know about what is the Roles and Responsibilities of Kubernetes administrator, why you should learn Docker and Kubernetes, Job opportunities for Kubernetes administrator in the market, and what to study Including Hands-On labs you must perform to clear Certified Kubernetes Administrator (CKA) certification exam by registering for our FREE Masterclass.
![Microsoft Agentic AI Business Solutions Architect [AB-100] | K21 Academy](https://test.k21academy.com/wp-content/uploads/2025/11/Microsoft-Agentic-AI-Business-Solutions-Architect-AB-100-Exam-Overview1.png)