


![]()
Machine learning is only as effective as the quality of the data it processes. Careful exploratory data analysis (EDA) is a critical step to uncover patterns, trends, and potential issues in datasets, ensuring the success of machine learning models. AWS offers a suite of tools and services that simplify the EDA process, making it more accessible and efficient for businesses and data scientists alike.
In this blog, we will explore the process of EDA using AWS tools and services, enabling you to make data-driven decisions with confidence. From understanding data fundamentals to leveraging advanced AWS features, this guide is designed to empower you in your machine learning journey.
This blog post cover:
- What Is Data Analysis?
- What Is Data?
- Usage Of Data Analysis
- Types Of Visualizations
- Why Data Preparation?
- What Is Amazon QuickSight?
- Amazon SageMaker Data Wrangler
- Conclusion
- FAQs
What Is Data Analysis?
Data analysis involves cleansing, transforming, and interpreting data to uncover valuable insights. This process helps organizations make informed decisions by analyzing trends, patterns, and anomalies in datasets.
Key Steps in Data Analysis:
- Data Cleaning: Removing inaccuracies and inconsistencies.
- Data Transformation: Converting raw data into a usable format.
- Insight Discovery: Identifying hidden information to inform decision-making.

Read More : About aws dms ( Amazon Database Migration Service )
What Is Data?
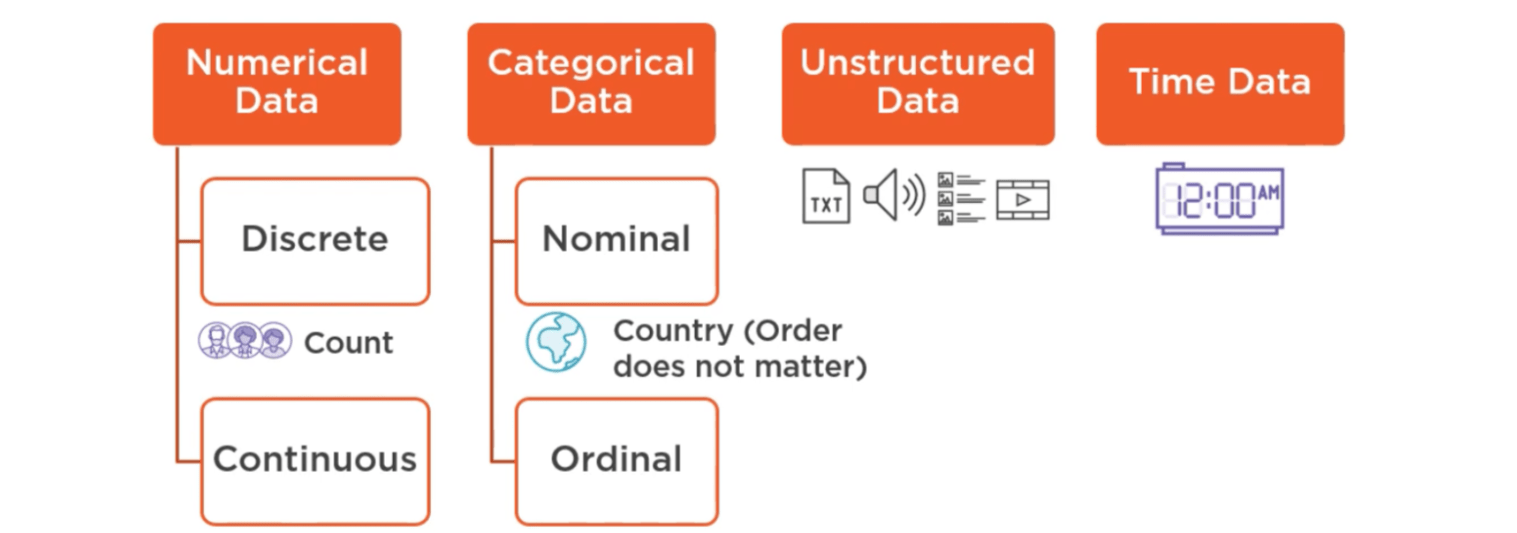
Data exists in various formats in the real world, such as numerical values, text, audio, or categorical labels. These formats can be grouped into four primary categories:
- Numerical Data: Represents numbers (e.g., age, temperature).
- Categorical Data: Represents classifications (e.g., colors: red, blue).
- Unstructured Data: Lacks a predefined order (e.g., audio files, text).
- Time Data: Represents data points in chronological order.
Usage Of Data Analysis
- Simplifies Complex Datasets: Helps comprehend massive datasets with millions of entries.
- Enhances Machine Learning: Assesses algorithm performance through visualizations.
- Identifies Relationships: Reveals potential correlations and patterns in data.

Read More : About AWS Certificate Manager click here
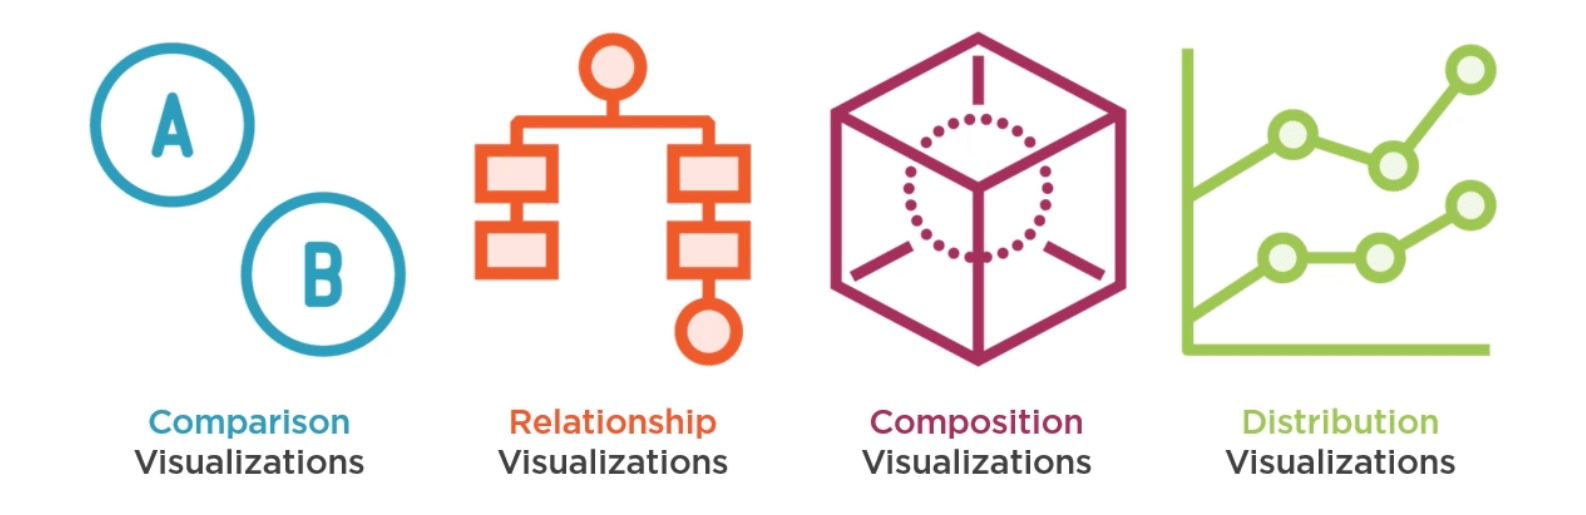
Types Of Visualizations
Visualizations play a crucial role in interpreting data. Here are the major types:
- Comparison Visualizations:
- Bar Chart
- Line Chart
- Relationship Visualizations:
- Scatter Plot
- Heat Map
- Composition Visualizations:
- Pie Chart
- Distribution Visualizations:
- Histogram
Check Out: What is Amazon Rekognition? Click here
Why Data Preparation?
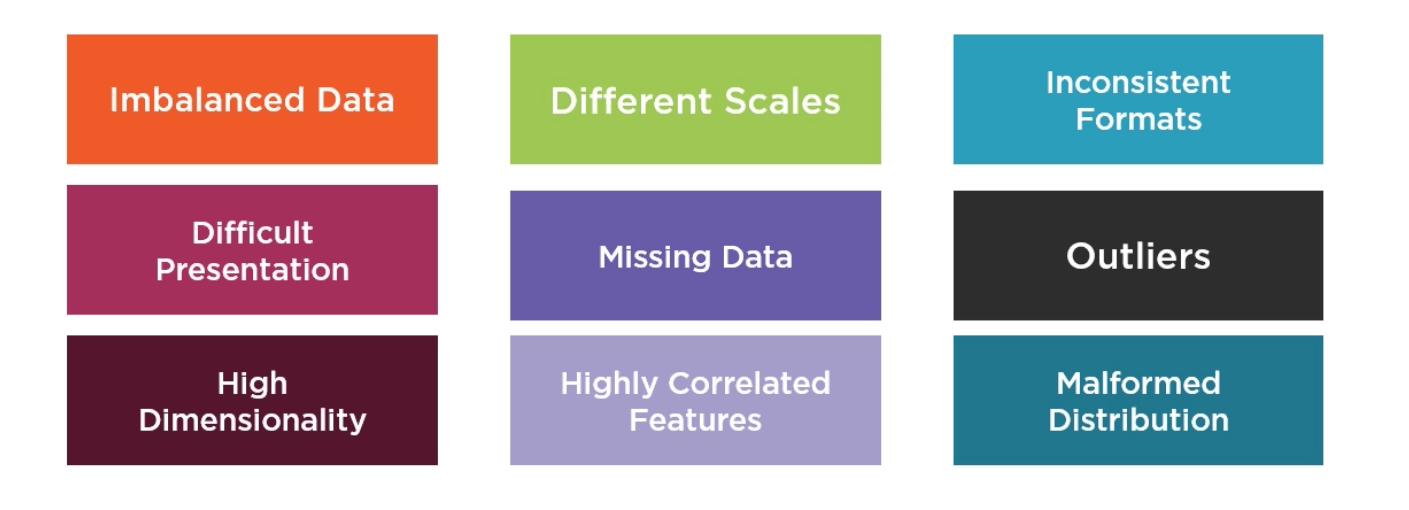
Before hand over, to the machine learning team, our data will most likely have many issues that prevent using it directly. Some of these issues are:
- Imbalanced dataset: It means that we might not have representative samples from all real cases of our problem domain. This is particularly important for classification problems.
- Different scales: our data might use different scales, which definitely means that we will have to make sure that we are using the same scales everywhere so that we compare apples to apples.
- Inconsistent formats: corruption in some sensors, we read the data from.
- Difficult presentation: Our data might not be straightforward numerical data that the machine learning models can directly consume, it can be audio files or even categorical data that require special processing.
- Missing values & Outliers: We might have missing data due to optional fields or even system failures. Or even worse, our data might contain some outliers that are not representative of the real problem domain.
- High dimensionality: our data is highly dimensional, that is, it has too many features which makes it difficult for us to visualize and train.
- Highly correlated features: Our data might also expect what so‑called features with high correlation, which are features that add no value to our machine learning model, or even worse, it can make our regression tasks perform worse.
- Malformed distribution: our data distribution might be malformed and not what the machine learning algorithms expect.
What Is Amazon QuickSight?
Amazon QuickSight is a business intelligence tool designed for non-technical users. It provides interactive visualizations and dashboards to help users make data-driven decisions.
Key Features:
- Affordable pricing.
- Scalable across large user bases.
- Powered by the SPICE engine for fast, in-memory calculations.
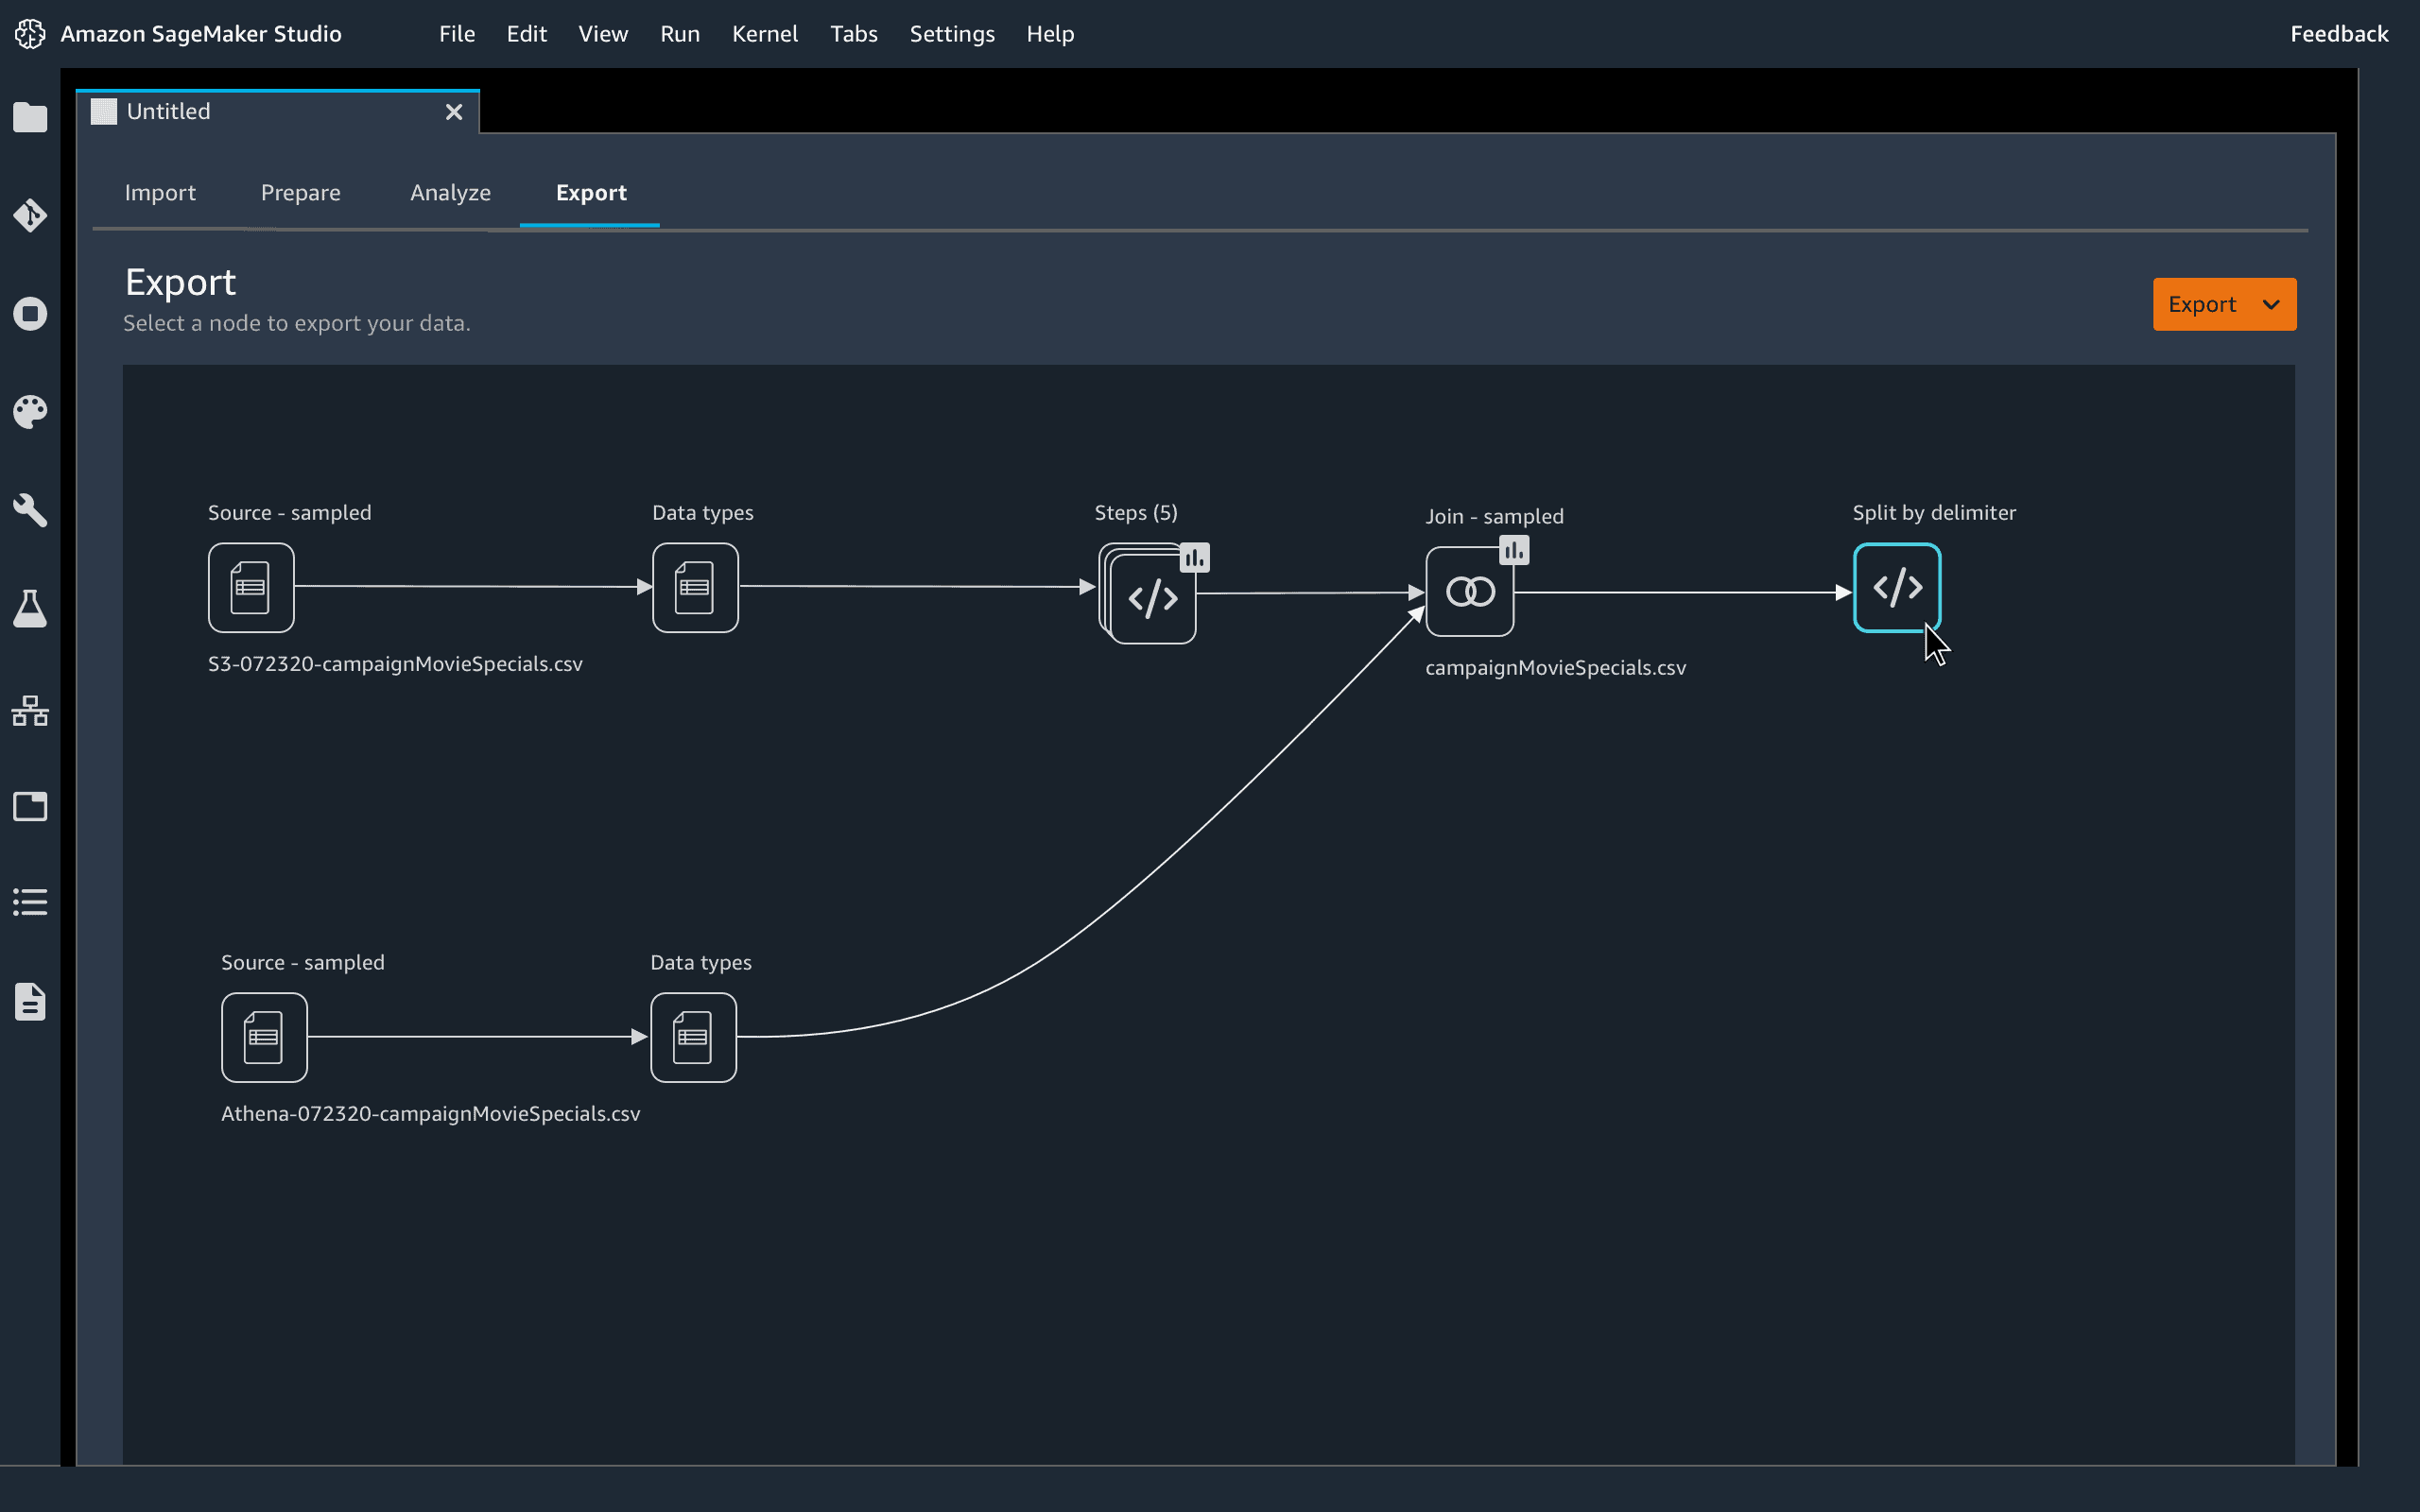
Amazon SageMaker Data Wrangler
Amazon SageMaker plays an important role in Exploratory Data Analysis with AWS ML. It is the quickest and simplest way to prepare data for machine learning. It gives us the ability to use a visual interface to access data, performs feature engineering and EDA, and seamlessly operationalizes your data stream by exporting it into an Amazon SageMaker Data Wrangler job, Amazon SageMaker pipeline, Python file, or SageMaker feature group.
SageMaker Data Wrangler provides a selection of 300+ pre-configured data transformations, such as one-hot encoding, convert column type, impute missing data with mean or median, rescale columns, and data/time embeddings, so you can mold your data into formats that can be definitely used for models without writing a single line of code. For example, you can disciple a text field column into a numerical column with a single click, or author custom conversions in PySpark, SQL, and Pandas.
Key Features:
- 300+ pre-configured data transformations (e.g., one-hot encoding, rescaling, handling missing values).
- Custom transformations using PySpark, SQL, and Pandas.
- No-code interface for quick conversions and adjustments.
For example, you can convert a text field into a numerical column with a single click or create custom scripts for advanced transformations.
Conclusion
Exploratory Data Analysis is a foundational step in any machine learning workflow. With AWS tools like Amazon QuickSight and SageMaker Data Wrangler, the process becomes faster, more intuitive, and highly efficient. By investing time in understanding and preparing your data, you set the stage for accurate predictions and meaningful insights, ultimately driving better decision-making and business outcomes.
Embrace AWS services to unlock the full potential of your data and streamline your machine learning journey.
FAQs
Q1: Why is Exploratory Data Analysis important for machine learning?
EDA is critical because it helps identify patterns, trends, and anomalies in data, ensuring that machine learning models are trained on clean and meaningful datasets.
How does Amazon SageMaker Data Wrangler simplify EDA?
Amazon SageMaker Data Wrangler provides a no-code interface and over 300 pre-configured transformations, making it easy to prepare and analyze data without extensive coding.
Q3: What types of visualizations are commonly used in EDA?
Common visualizations include bar charts, scatter plots, pie charts, and histograms, each serving a specific purpose in understanding data.
Q4: What are the key challenges in data preparation?
Challenges include handling missing values, dealing with imbalanced datasets, standardizing formats, and reducing high dimensionality.
Q5: How does Amazon QuickSight support business intelligence?
Amazon QuickSight provides interactive dashboards powered by the SPICE engine, enabling fast and scalable visualizations for non-technical users.
Q6: What AWS services can enhance forecast accuracy?
Services like Amazon Forecast, AWS Glue, and Amazon SageMaker are pivotal in improving forecast accuracy by providing tools for clean data, automation, and robust modeling.
Related References
- Join Our Generative AI Whatsapp Community
- Introduction To Amazon SageMaker Built-in Algorithms
- Introduction to Generative AI and Its Mechanisms
- Mastering Generative Adversarial Networks (GANs)
- Generative AI (GenAI) vs Traditional AI vs Machine Learning (ML) vs Deep Learning (DL)
- AWS Certified AI Practitioner (AIF-C01) Certification Exam
- AWS Certified Machine Learning Engineer – Associate (MLA-C01) Exam
Next Task For You
Don’t miss our EXCLUSIVE Free Training on Generative AI on AWS Cloud! This session is perfect for those pursuing the AWS Certified AI Practitioner certification. Explore AI, ML, DL, & Generative AI in this interactive session.
Click the image below to secure your spot!

![Microsoft Agentic AI Business Solutions Architect [AB-100] | K21 Academy](https://test.k21academy.com/wp-content/uploads/2025/11/Microsoft-Agentic-AI-Business-Solutions-Architect-AB-100-Exam-Overview1.png)