


![]()
Landing a machine learning job can feel like a daunting challenge, right? Whether you’re a seasoned data scientist or just starting out, acing that interview requires more than just theoretical knowledge. It’s about being prepared for the toughest questions that will test your problem-solving skills, technical expertise, and understanding of machine learning concepts.
But don’t worry! We’ve got you covered. In this Blog, we’ve compiled the top 20 machine learning interview questions you absolutely must know—so you can walk into that interview with confidence and make a lasting impression. Ready to dive in? Let’s break down the questions that could land you your dream ML role!
Related Readings: Top 90+ Machine Learning Interview Questions with AWS & Azure Insights in 2025
Table of Contents
- What are some real-life applications of clustering algorithms?
- How to choose an optimal number of clusters?
- What is feature engineering? How does it affect the model’s performance?
- What is overfitting in machine learning and how can it be avoided?
- Why can’t we use linear regression for a classification task?
- Why do we perform normalization?
- What is the difference between precision and recall?
- What is the difference between upsampling and downsampling?
- What is data leakage and how can we identify it?
- Explain the classification report and the metrics it includes.
- What are some of the hyperparameters of the random forest regressor which help to avoid overfitting?
- What is the bias-variance tradeoff?
- Is it always necessary to use an 80:20 ratio for the train-test split?
- What is Principal Component Analysis (PCA)?
- What is one-shot learning?
- What is the difference between Manhattan Distance and Euclidean distance?
- What is the difference between one-hot encoding and ordinal encoding?
- How can you conclude about the model’s performance using the confusion matrix?
- Explain the working principle of SVM.
- What is the difference between the k-means and k-means++ algorithms?

1. What are some real-life applications of clustering algorithms?
Clustering algorithms are widely used for grouping similar data points. Real-life applications include:
- Customer segmentation: Grouping customers based on purchasing behavior for targeted marketing.
- Recommendation systems: Personalizing suggestions based on user interests.
- Anomaly detection: Identifying fraud or defective items by grouping normal vs abnormal data.
- Image compression: Reducing storage by grouping similar pixels.
- Healthcare: Grouping patients with similar conditions for targeted treatments.
- Document categorization: Sorting documents into categories for easier retrieval.

Related reading: Machine Learning Algorithms & their Use Cases
2. How to choose an optimal number of clusters?
There are multiple methods to find the optimal number of clusters:
- Elbow Method: Plot the within-cluster sum of squares (WCSS) vs. number of clusters and choose where the curve flattens.
Example: If you are clustering customers based on their spending behavior, you might notice the WCSS curve flattening at 4 clusters, suggesting 4 customer segments. - Silhouette Score: Measures how similar points are within their cluster compared to other clusters. A higher score indicates better-defined clusters.
Example: A silhouette score of 0.8 or above indicates that your clusters are well-separated. - Gap Statistic: Compares clustering results with random clustering to determine the appropriate number of clusters.
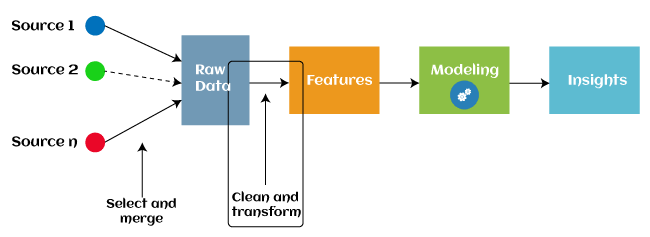
3. What is feature engineering? How does it affect the model’s performance?
Feature engineering involves creating new features or transforming existing ones to improve model performance. It helps the model better capture underlying patterns, providing better predictive power. By developing new features based on domain knowledge or mathematical operations, it can significantly improve a model’s accuracy and interpretability.
Example: In a housing price prediction model, the raw data might contain features like the number of bedrooms, square footage, and neighborhood. You can engineer new features like the “price per square foot” or “neighborhood quality score” to enhance the model’s predictive accuracy.
4. What is overfitting in machine learning, and how can it be avoided?
Overfitting occurs when a model learns both the underlying patterns and the noise from training data, leading to poor performance on unseen data.
Example: If a model is trained on a small dataset with many noise features, it may perform well on the training data but fail to predict new, unseen examples.
- To avoid overfitting:
- Early stopping: Stop training when validation performance stops improving.
- Regularization: Use techniques like L1 or L2 regularization to penalize complex models.
- Cross-validation: Use different subsets of data to train and evaluate the model, ensuring robustness.
- More data: Larger datasets help the model generalize better.
5. Why can’t we use linear regression for a classification task?
Linear regression outputs continuous, unbounded values, whereas classification requires discrete, bounded values. Using linear regression for classification can lead to inaccurate predictions and a non-convex error function, which may cause the model to get stuck in suboptimal solutions.
Example: If you try to use linear regression for classifying emails as “spam” or “not spam”, it will output continuous values (e.g., 0.7), which don’t correspond directly to the categories. Logistic regression, on the other hand, outputs probabilities between 0 and 1, making it more suitable for classification.
6. Why do we perform normalization?
Normalization scales the features of the dataset to a standard range, typically between 0 and 1. It is crucial when using gradient-based optimization methods like neural networks, as it ensures that no feature dominates the others and speeds up convergence, making the training more stable and efficient.
Example: If you’re working with height (in cm) and weight (in kg) as features, normalizing will ensure that neither feature disproportionately affects the model due to their different ranges (height ranging from 100-200 cm and weight ranging from 40-150 kg).
7. What is the difference between precision and recall?
-
Precision: Measures the accuracy of positive predictions, defined as:
Precision=TPTP+FP\text{Precision} = \frac{TP}{TP + FP}
-
Recall: Measures the model’s ability to correctly identify all positive instances, defined as:
Recall=TPTP+FN\text{Recall} = \frac{TP}{TP + FN}
Example: In a medical test, precision is important when the cost of false positives (incorrectly diagnosing healthy people as sick) is high, while recall is important when false negatives (missing a diagnosis for sick patients) are critical
Both metrics are important, depending on the cost of false positives (precision) vs. false negatives (recall).
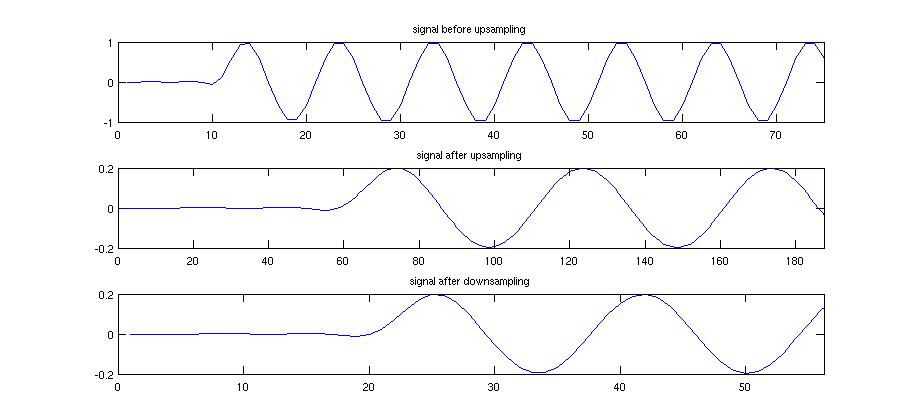
8. What is the difference between upsampling and downsampling?
- Upsampling: Increases the number of samples in the minority class by duplicating or generating synthetic data, helping balance the dataset.
Example: In fraud detection, you may have very few fraud cases (minority class), so you use upsampling to replicate the fraud cases to make the dataset balanced. - Downsampling: Reduces the number of samples in the majority class, which may lead to data loss, but balances the dataset.
Example: In a large email dataset, downsampling might involve randomly reducing the number of “not spam” emails to match the number of “spam” emails.
9. What is data leakage, and how can we identify it?
Data leakage occurs when information from outside the training dataset is used in the model, leading to overly optimistic performance estimates. This can happen if features are correlated with the target variable. Identifying data leakage involves checking for high correlation between features and the target variable that should not exist during training.
Example: If the target variable in a predictive model is related to the time of day, and the dataset includes future data (e.g., future sales), this can cause data leakage because the model is indirectly using future information to predict outcomes.
10. Explain the classification report and the metrics it includes.
A classification report summarizes the performance of a classification model. It includes:
- Precision: Accuracy of positive predictions.
- Recall: Ability to find all positive instances.
- F1-Score: Harmonic mean of precision and recall.
- Support: Number of actual occurrences for each class.
- Accuracy: Overall correct predictions.
- Macro Average: Average metrics across all classes.
- Weighted Average: Average metrics, weighted by class support.

11. What are some of the hyperparameters of the random forest regressor that help to avoid overfitting?
Key hyperparameters to avoid overfitting:
- max_depth: Restricts the depth of each tree to avoid excessive complexity.
Example: If your tree is too deep, it may capture noise in the data, so setting a max_depth of 5 will limit its growth. - n_estimators: The number of trees in the forest.
- min_samples_split: Minimum number of samples required to split an internal node.
Example: If set to 10, each node needs at least 10 samples to split, ensuring the model doesn’t get overly specific to the data. - max_leaf_nodes: Limits the number of leaf nodes in the tree.
12. What is the bias-variance tradeoff?
Bias-variance tradeoff refers to balancing two sources of error:
- Bias: Error due to overly simplistic models (underfitting).
Example: A linear model predicting housing prices might ignore important non-linear relationships in the data. - Variance: Error due to model complexity (overfitting).
The goal is to find a model that minimizes both bias and variance, resulting in the best generalization to new data.
Example: A decision tree that splits the data too much and fits every noise point.
13. Is it always necessary to use an 80:20 ratio for the train-test split?
No, the 80:20 split is not a strict rule. The train-test split ratio depends on the dataset size and complexity. Common alternatives include:
-
70:30 Split: Useful for larger datasets where more data is available for training.
Example: If you have millions of data points, a 70:30 split ensures enough data is allocated for both training and testing.
-
90:10 Split: Often used when data is scarce, ensuring that most of the data is used for training.
Example: In rare event prediction, a smaller test set is sufficient to evaluate model performance.
The key is to balance training and testing data to ensure that the model is well-validated and can generalize to unseen data.
14. What is Principal Component Analysis (PCA)?
PCA is a dimensionality reduction technique that transforms high-dimensional data into a lower-dimensional space while retaining most of the variance in the data. It’s commonly used to reduce data complexity and visualize high-dimensional data in fewer dimensions.

Example: In image processing, each pixel might be considered a feature. Using PCA, you can reduce the number of features (pixels) while retaining the most important information, making the model faster and easier to interpret.
15. What is one-shot learning?
One-shot learning is a machine learning technique where the model learns to recognize patterns from a single example, rather than learning from a large dataset.
-
Example: In face recognition, the model is shown one image of a person and then is expected to recognize that person in any subsequent images, even if the new images have different angles or lighting conditions.
One-shot learning is useful in situations where acquiring large datasets is impractical, like identifying rare diseases based on very few instances.
16. What is the difference between Manhattan Distance and Euclidean distance?
- Manhattan Distance: Sum of the absolute differences between coordinates.
- Euclidean Distance: Square root of the sum of squared differences between coordinates.
Both are used to calculate distances between data points, but Euclidean distance is commonly used in clustering tasks like K-means.
17. What is the difference between one-hot encoding and ordinal encoding?
- One-hot encoding: Creates a binary column for each category and marks the presence with 1 and absence with 0.
- Ordinal encoding: Assigns a numeric value to each category based on its rank or order.

18. How can you conclude about the model’s performance using the confusion matrix?
A confusion matrix helps evaluate the performance of a classification model by comparing predicted values to actual labels. It includes the following metrics:
-
True Positives (TP): Correctly predicted positive instances.
-
False Positives (FP): Incorrectly predicted as positive.
-
True Negatives (TN): Correctly predicted negative instances.
-
False Negatives (FN): Incorrectly predicted as negative.
From this matrix, you can calculate metrics like accuracy, precision, recall, and F1-score.
-
Example: If you are evaluating a spam classifier, a high number of True Positives and True Negatives indicates good performance, while high False Positives and False Negatives suggest issues with the model’s predictions.
19. Explain the working principle of SVM.
Support Vector Machine (SVM) is a supervised learning algorithm used for classification tasks. The goal is to find the hyperplane that best separates different classes while maximizing the margin between the classes.
-
Example: In a binary classification problem (spam vs. not spam), SVM will try to find a hyperplane that maximizes the distance between the nearest points (support vectors) of both classes.
SVM can also use kernel functions to map data into higher-dimensional spaces, allowing it to handle non-linear decision boundaries effectively.
20. What is the difference between the k-means and k-means++ algorithms?
- K-means: Initializes centroids randomly, which can lead to poor clustering if centroids are poorly initialized.
- K-means++: Improves the initialization by selecting centroids based on their distance from existing centroids. This results in better clustering and faster convergence.Example: In K-means++, the first centroid is chosen randomly, and the subsequent centroids are chosen with a probability proportional to their distance from the existing centroids. This helps in obtaining more meaningful initial cluster centers.
Conclusion
These Top 20 Machine Learning Interview Questions will help you build a solid foundation for your ML interview preparation. By mastering these questions and concepts, you will increase your chances of acing your interview at top tech companies. Practice regularly, stay updated with new trends, and prepare yourself for success in the field of machine learning!
Next Task: Enhance Your AI/ML Skills

![Microsoft Agentic AI Business Solutions Architect [AB-100] | K21 Academy](https://test.k21academy.com/wp-content/uploads/2025/11/Microsoft-Agentic-AI-Business-Solutions-Architect-AB-100-Exam-Overview1.png)