This blog post will cover some quick tips including FAQs on the topics that we covered in the Day 6 live session which will help to clear Certification [DP-100] & get a better-paid job.
In the previous week’s sessions, in Day 5 session we got an overview of Deploy and Consuming Models and Training Optimal Models. And in this week’s Day 6 Live Session of the AI/ML & Azure Data Scientist Certification [DP-100] training program, we covered the concepts of Responsible Machine Learning and Monitoring Models. We also covered hands-onLab 17, Lab 18, Lab 19, Lab 20 and Lab 21 out of our 15+ extensive labs.
So, here are some of the Q & As asked during the Live session fromModule 9: Responsible Machine Learning and Module 10: Monitoring Models & Hands-on Labs of Microsoft Azure Data Scientist [DP-100].
Responsible Machine Learning.
Machine learning models are increasingly used to inform decisions that affect people’s lives. For example, a prediction made by a machine learning model might influence:
Approval for a loan, insurance, or other financial services.
Acceptance into a school or college course.
Eligibility for a medical trial or experimental treatment.
Inclusion in a marketing promotion.
Selection for employment or promotion.
With such critical decisions in the balance, confidence that the machine learning models we rely on predict, and don’t discriminate for or against subsets of the population based on ethnicity, gender, age, or other factors
Q1: What is model interpretability?
A: A machine learning algorithm’s interpretability refers to however straightforward it’s for humans to know the processes it uses to hit its outcomes. till recently, computing algorithms are infamous for being “black boxes,” providing no thanks to perceiving their inner processes and creating it troublesome to elucidate ensuing insights.
Q2: What is differential privacy?
A: Differential privacy seeks to protect individual data values by adding statistical “noise” to the analysis process. The math involved in adding the noise is complex, but the principle is fairly intuitive – the noise ensures that data aggregations stay statistically consistent with the actual data values allowing for some random variation, but make it impossible to work out the individual values from the aggregated data. In addition, the noise is different for each analysis, so the results are non-deterministic – in other words, two analyses that perform the same aggregation may produce slightly different results
Q3: What is Mitigating bias?
A: Optimizing for fairness in a machine learning model is a socio-technical challenge. In other words, it’s not always something you can achieve purely by applying technical corrections to a training algorithm. However, there are some strategies you can adopt to mitigate bias
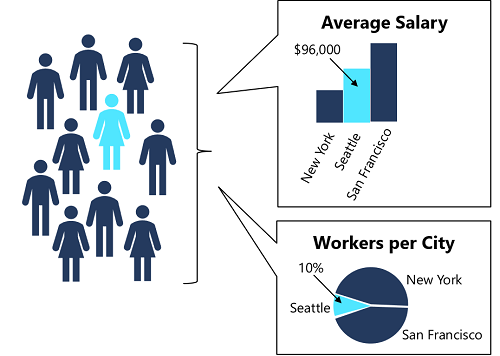
Q4: What is Fairness in a model?
A: When we consider the concept of fairness concerning predictions made by machine learning models, it helps to be clear about what we mean by “fair”.
For example, suppose a classification model is used to predict the probability of successful loan repayment and therefore influences whether or not the loan is approved. The model will likely be trained using features that reflect the characteristics of the applicant, such as:
Age
Employment status
Income
Savings
Current debt
These features are used to train a binary classification model that predicts whether an applicant will repay a loan
Q5: How to Analyze model fairness with Fairlearn?
A: Fairlearn is a Python package that you can use to analyze models and evaluate disparity between predictions and prediction performance for one or more sensitive features.
It works by calculating group metrics for the sensitive features you specify. The metrics themselves are based on standard scikit-learn model evaluation metrics, such as accuracy, precision, or recall for classification models.
Q6: How to Measure disparity in prediction performance?
A: When you train a machine learning model using a supervised technique, like regression or classification, you use metrics achieved against hold-out validation data to evaluate the overall predictive performance of the model. For example, you might evaluate a classification model based on accuracy, precision, or recall.
To evaluate the fairness of a model, you’ll apply a similar predictive performance metric to subsets of the data, support the sensitive options on that your population is sorted, and live the disparity in those metrics across the subgroups.
Q7: What are the Potential causes of disparity?
A: When you find a disparity between prediction rates or prediction performance metrics across sensitive feature groups, it’s worth considering potential causes. These might include:
Data imbalance. Some teams could also be overrepresented within the training data, or the info could also be skewed so cases among a particular cluster aren’t representative of the population.
Indirect correlation. The sensitive feature itself might not be predictive of the label, however, there could also be a hidden correlation between the sensitive feature and a few different feature that influences the prediction. For example, there’s likely a correlation between age and credit history, and there’s likely a correlation between credit history and loan defaults. If the credit history feature is not included in the training data, the training algorithm may assign a predictive weight to age without accounting for credit history, which might make a difference to loan repayment probability.
Societal biases. Subconscious biases in the data collection, preparation, or modelling process may have influenced feature selection or other aspects of model design.
Q8: What is Feature importance in the model?
A: Model explainers use statistical techniques to calculate feature importance. This enables you to quantify the relative influence each feature in the training dataset has on label prediction. Explainers work by evaluating a test data set of feature cases and the labels the model predicts for them. Feature importance is of two types :
1. Global Feature importance
2. Local Feature importance
Monitoring Models
Application Insights is an application performance management service in Microsoft Azure that enables the capture, storage, and analysis of telemetry data from applications.
You can use Application Insights to monitor telemetry from many kinds of applications, including applications that are not running in Azure. All that’s required is a low-overhead instrumentation package to capture and send the telemetry data to Application Insights. The necessary package is already included in Azure Machine Learning Web services, so you can use it to capture and review telemetry from models published with Azure Machine Learning.
Q9: What’s the difference between AzureMonitor, LogAnalytics, and Application Insights?
A: In September 2018, Microsoft combined Azure Monitor, Log Analytics, and Application Insights into a single service to provide powerful end-to-end monitoring of your applications and the components they rely on. Features in Log Analytics and Application Insights have not changed, although some features have been rebranded to Azure Monitor in order to better reflect their new scope. The log data engine and query language of Log Analytics is now referred to as Azure Monitor Logs.
Q10: Do you have to provide the target data for drift calculation with the baseline or is collected by the insight services?
A: To log telemetry in application insights from an Azure machine learning service, you must have an Application Insights resource associated with your Azure Machine Learning workspace, and you must configure your service to use it for telemetry logging.
Q11: How is the target data generated ??
A: Over time, you can collect new data with the same features as your baseline training data. To compare this new data to the baseline data, you must define a target dataset that includes the features you want to analyze for data drift as well as a timestamp field that indicates the point in time when the new data was current -this enables you to measure data drift over temporal intervals. The timestamp can either be a field in the dataset itself or derived from the folder and filename pattern used to store the data
Q12: Do you need to have programming skills to deploy the models?
A: No, you don’t require any programming skills to deploy the models, but if you have any it will be a bonus for you.
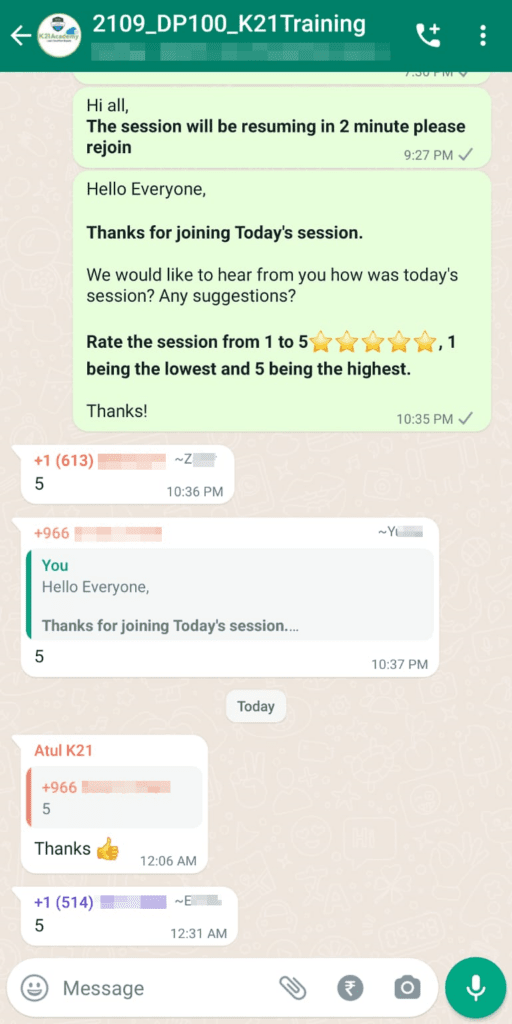
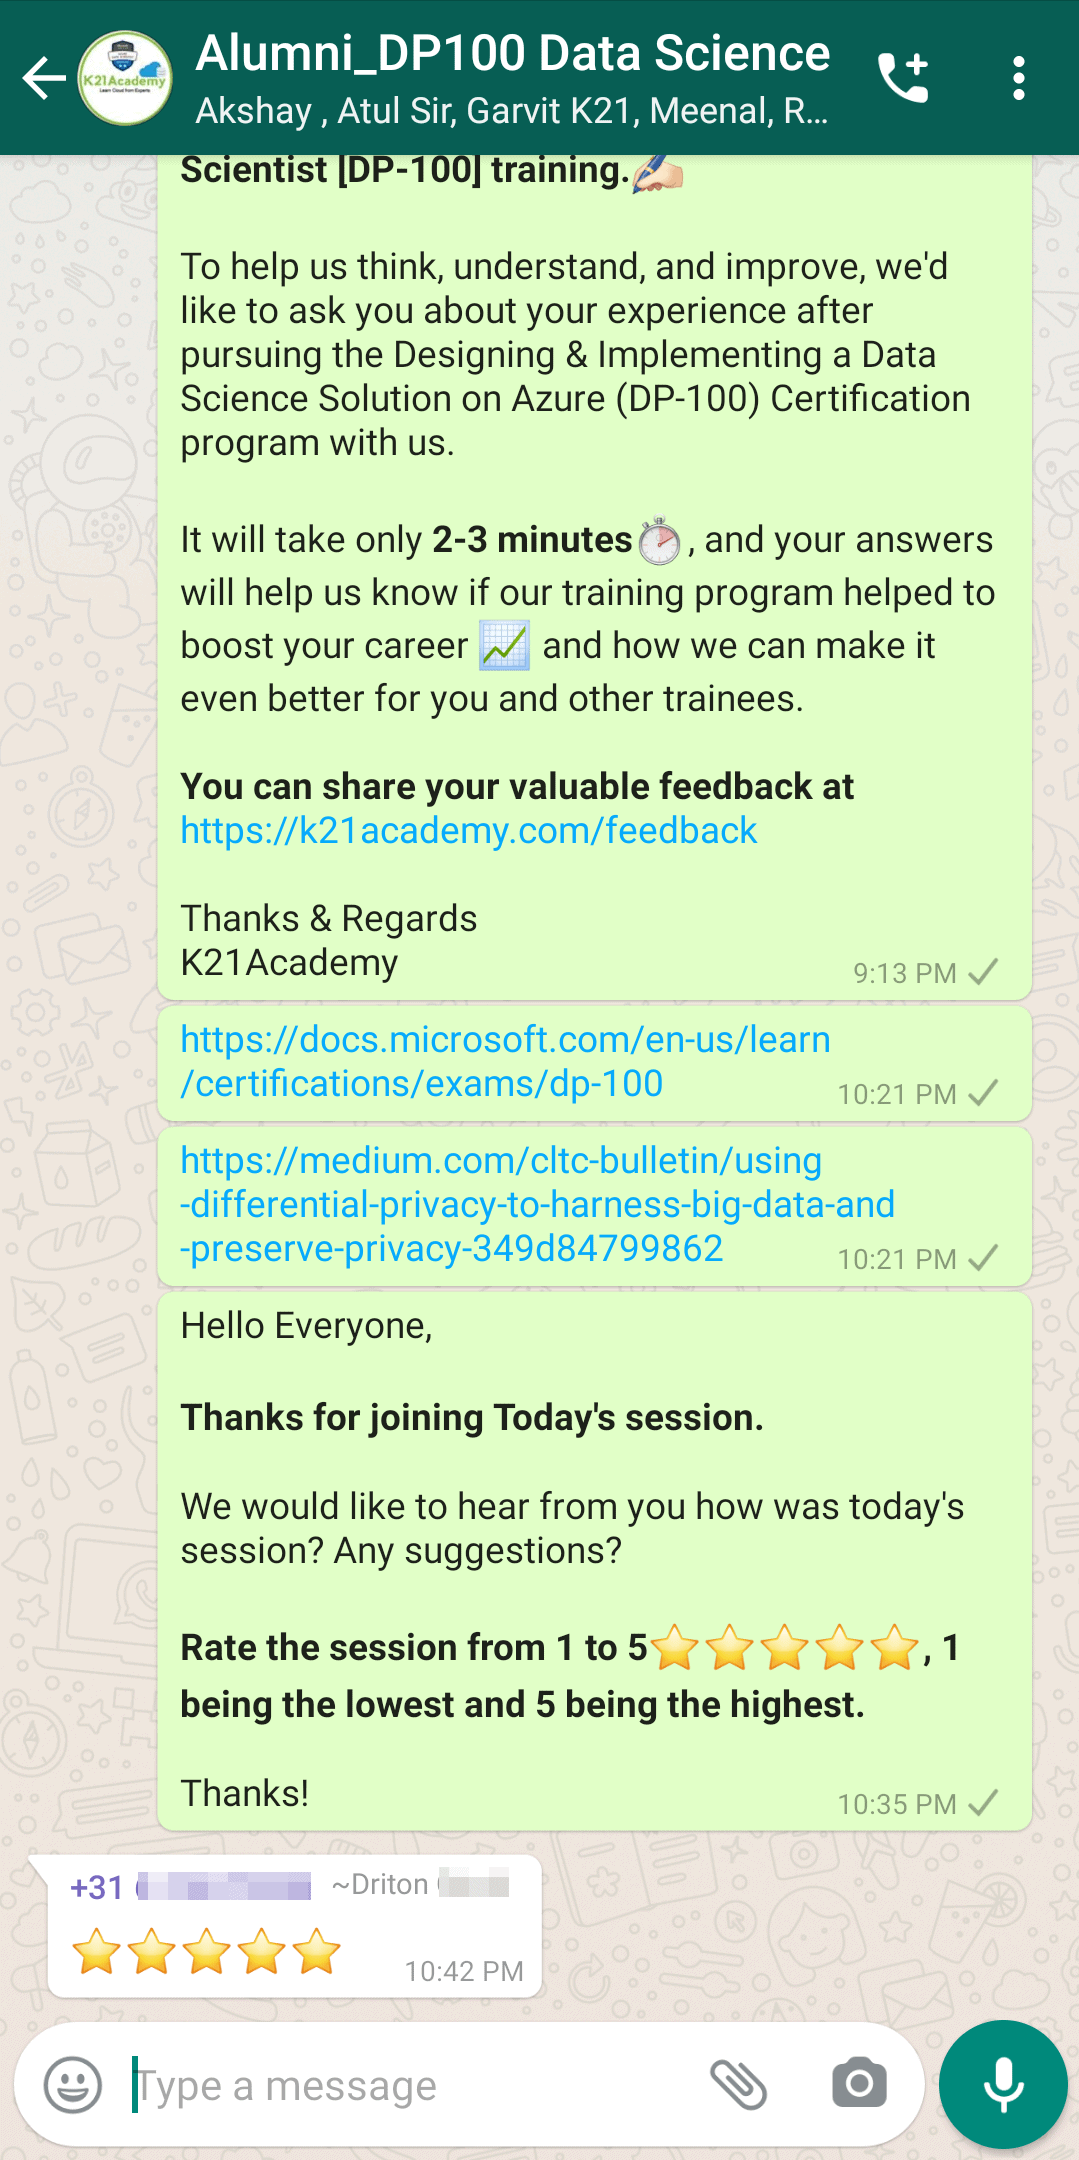
Feedback Received…
From our DP-100 day 6 session, we received some good feedback from our trainees who had attended the session, so here is a sneak peek of it.
Quiz Time (Sample Exam Questions)!
With our AI/ML & Azure Data Science training program, we cover 150+ sample exam questions to help you prepare for the certification DP-100.
Check out one of the questions and see if you can crack this…
Ques: You have a forecasting ML model in production. After several months of live operation, you notice that the model has been degrading in terms of predictive accuracy. You have to introduce tools to detect and quantify the problem.
What is the best way to do that?
A. Collect new data; add a new ImportData step to your pipeline; import the new data and use it further on B. Collect new data; add the new data to the training dataset; retrain the model; configure a DataDriftDetector C. Collect new data; use the training dataset as baseline; register the new data as target dataset; configure a DataDriftDetector D. Collect new data as a new version of the training dataset; write a Python script to profile and compare them; retrain the model if necessary; publish the new model
Comment with your answer & we will tell you if you are correct or not!!
Begin your journey toward Mastering Azure Cloud and landing high-paying jobs. Just click on the register now button on the below image to register for a Free Class on Mastering Azure Cloud: How to Build In-Demand Skills and Land High-Paying Jobs. This class will help you understand better, so you can choose the right career path and get a higher paying job.
I started my IT career in 2000 as an Oracle DBA/Apps DBA. The first few years were tough (<$100/month), with very little growth.
In 2004, I moved to the UK. After working really hard, I landed a job that paid me £2700 per month.
In February 2005, I saw a job that was £450 per day, which was nearly 4 times of my then salary.


![Microsoft Agentic AI Business Solutions Architect [AB-100] | K21 Academy](https://test.k21academy.com/wp-content/uploads/2025/11/Microsoft-Agentic-AI-Business-Solutions-Architect-AB-100-Exam-Overview1.png)