

![]()
Most of us love the GUI based interactions rather than the old and boring CLI ones. So, to make things easier Kubernetes Dashboard was developed which definitely has gained more attention of people who were looking at Kubernetes in dilemma. The Kubernetes Dashboard is also a part of the new Certified Kubernetes Security Specialist (CKS) exam, and it comes under the Cluster Setup of the CKS exam topics. If you are looking for a resource to learn what exactly is a Kubernetes Dashboard, what does it do, and how to install it then, you have arrived at the right place where you find a thorough guide to all of it.
In this blog post, I’m going to cover:
- What is the Kubernetes Dashboard?
- What does it do?
- How to install the Kubernetes Dashboard?
- Accessing the Dashboard
Kubernetes Dashboard Overview
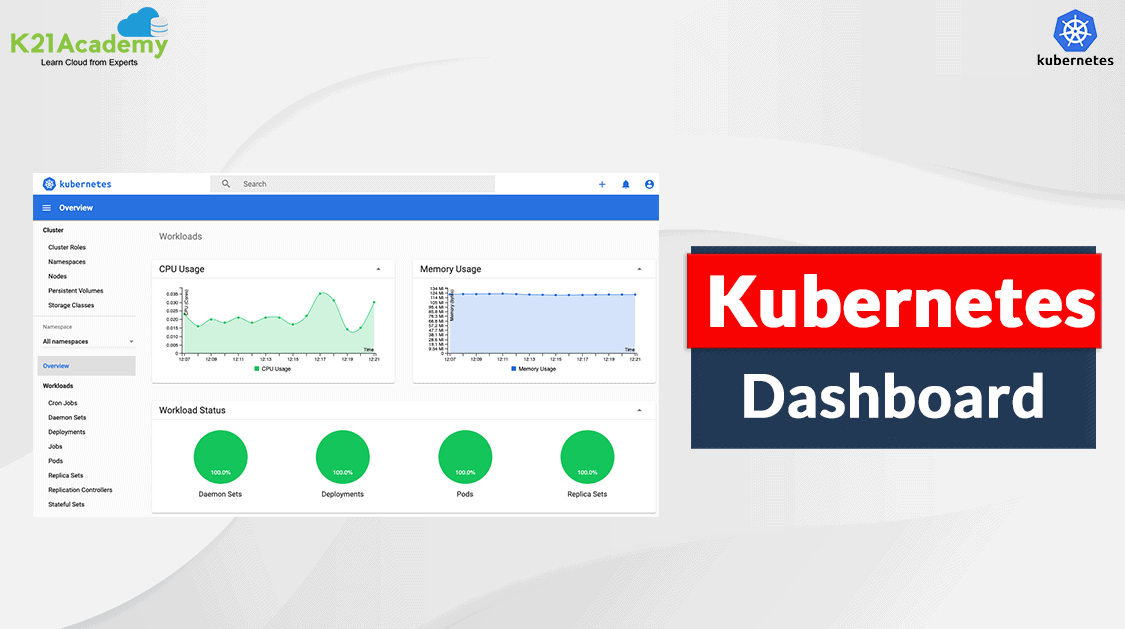
The web-based Kubernetes console, which is a general-purpose UI made to look after the Cluster in Kubernetes. Surprisingly, even the dashboard is nothing but a container that access the cluster inform from within the cluster. So, it’s just another resource for Kubernetes to manage.
 Kubernetes Dashboard
It is used for deploying containerized applications as well as for general cluster resource management. As mentioned before it is very useful to have a visual representation of our cluster in a user-friendly interface.
Also Check: What is the difference between docker and Kubernetes.
What does the Kubernetes dashboard do?
Here are the things you can do with the Kubernetes dashboard:
- You will get an overview of applications running on your cluster.
- To create or modify the individual Kubernetes resources for example Deployments, Jobs, etc.
- It provides the information on the state of Kubernetes resources in your cluster, and on any errors that may have occurred.
Learn with us: Check out our kubernetes training & understand Kubernetes basics in a better way.
Installing the Kubernetes Dashboard
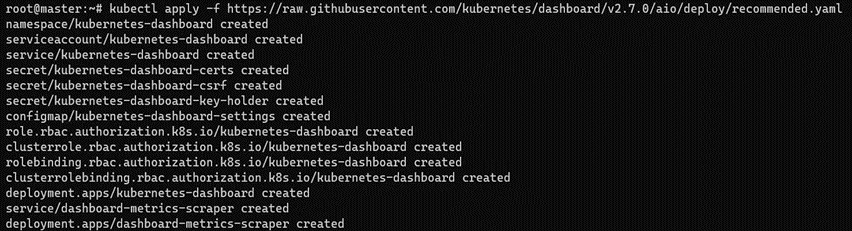
Deploying the Kubernetes Dashboard is not a tough job, you’d have to follow the step-by-step procedure given below. We need to apply the recommended deployment descriptor file:
$ kubectl apply -f https://raw.githubusercontent.com/kubernetes/dashboard/v2.7.0/aio/deploy/recommended.yaml If everything was right, all the required resources are created and we should be able to see the below output:
Also Read: Our blog post on Configmap Kubernetes.
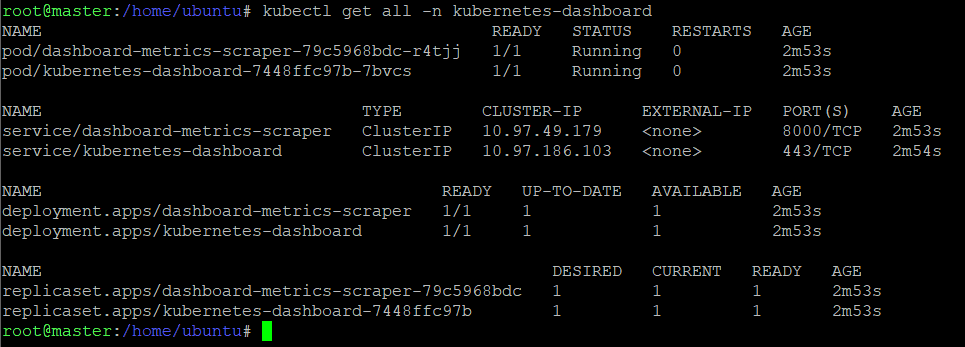
Next step is to check all the resources by the below command
$ kubectl get all -n kubernetes-dashboard
Read More: About Prometheus Grafana Kubernetes.
Accessing the Kubernetes Dashboard
We can access the Kubernetes dashboard in the following ways:
- kubectl port-forward (only from kubectl machine)
- kubectl proxy (only from kubectl machine)
- Kubernetes Service (NodePort/ClusterIP/LoadBalancer)
- Ingress Controller (Layer 7)
Now, let us look at a couple of ways of accessing the K8s Dashboard.
Check Out: What is Kubernetes deployment.
Using Kubernetes Service
Once the Kubernetes dashboard deployment is completed you can access the Kubernetes dashboard by following the next set of instructions.
This will be a proxy server between your machine and K8s API server. Since the service type is ClusterIP by default, we can’t access the dashboard outside the cluster as it is not exposed. But if we want to access the dashboard from outside the cluster we have to change the type of the service to either NodePort or LoadBalancer.
Via NodePort
We will have to change the type of service from ClusterIP to NodePort. So, give the following command to edit the service and make the following changes:
$ kubectl edit service/kubernetes-dashboard -n kubernetes-dashboard
Before:
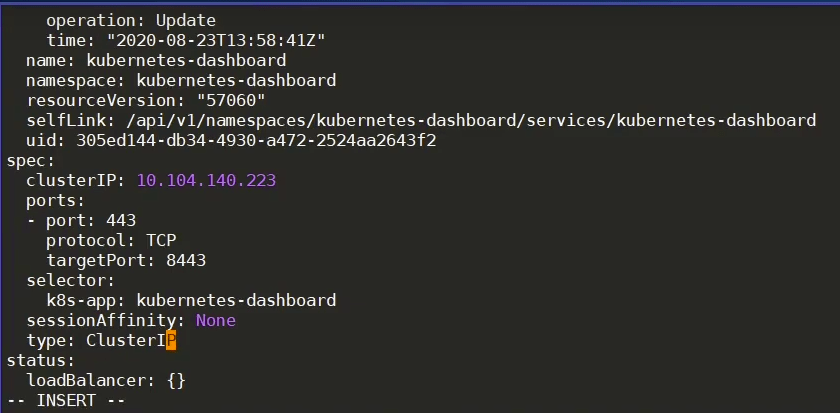
After: You can give the IP of your wish if 32321 is occupied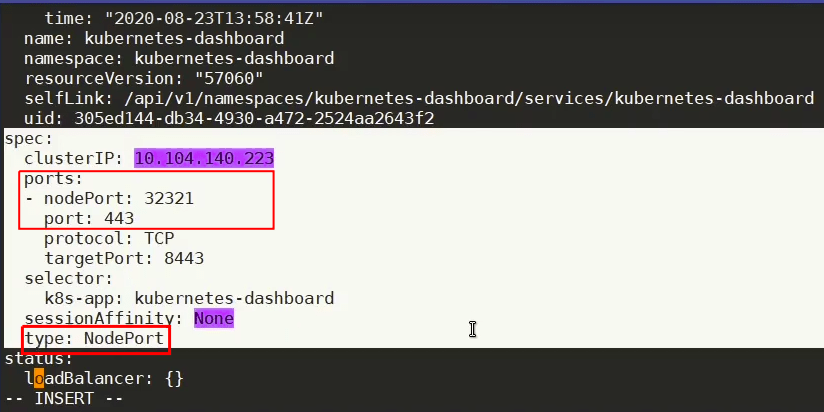
Now, check if the service was changed successfully by giving the following command:
$ kubectl get svc
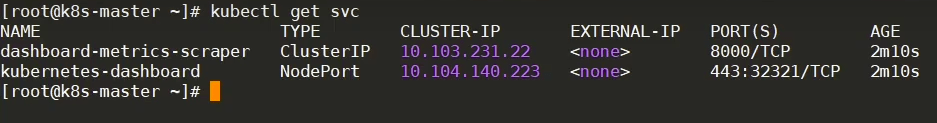
Since the service type has been changed successfully and the next step is to check on which node is our dashboard is running. After getting to know the node we will have to check for the corresponding IP of the node.
Check Out: What is Docker and Kubernetes.
Now, to view the dashboard in the browser, navigate to the following address in the browser:
http://<NodeIp>:<dashboard port>
For instance: From the below image you can see the dashboard is running inside the k8s-node02 whose IP address is 192.168.99.126
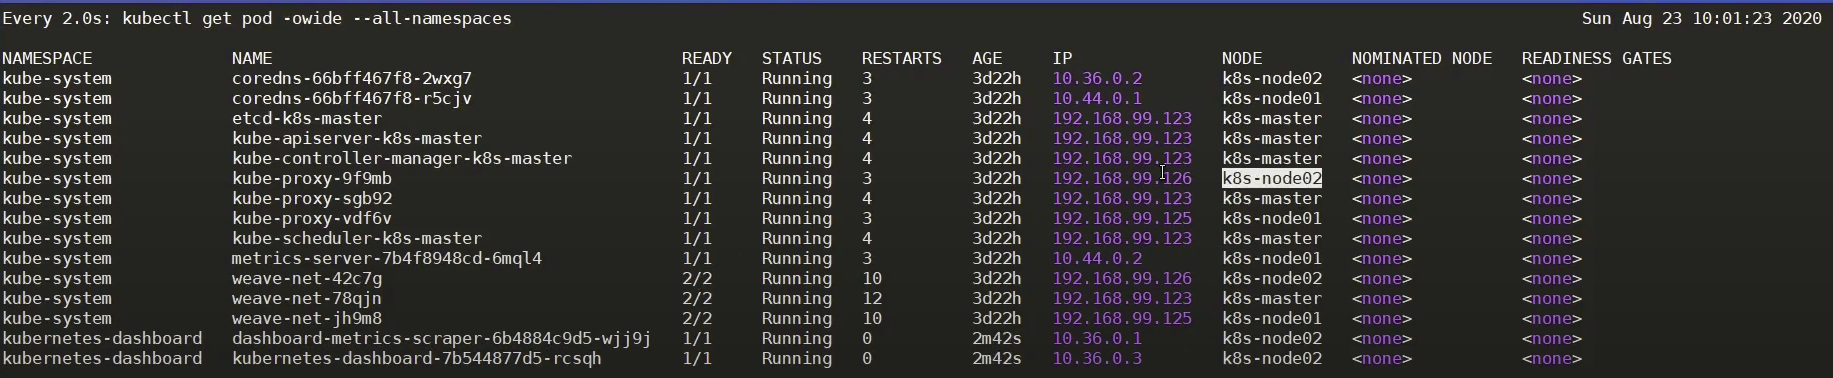
Hence, to navigate to the dashboard we’d be giving http://192.168.99.126:32321
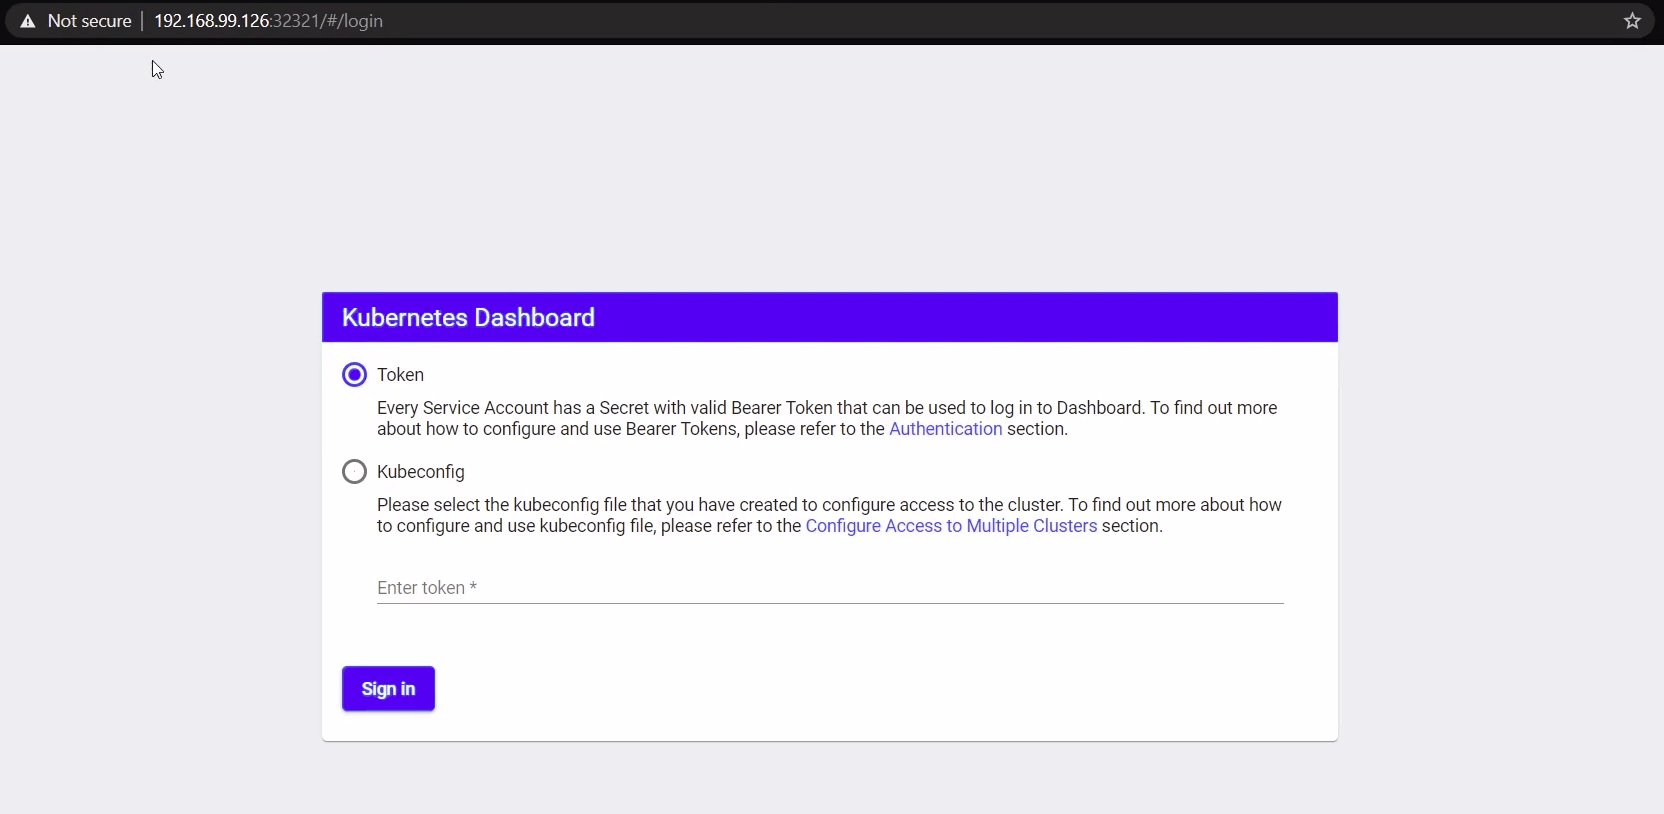
Check Out: How to Create Annotations in Kubernetes.
So, we will have to log in either via the Token or Kubeconfig file. Token for now is the better option. In order to get the Token, we will first have to create a service account which has cluster role binding. Follow the next set of commands to log in to the dashboard:
$ vim k8s-serviceaccount.yml
cat k8s-serviceaccount.yaml
apiVersion: v1
kind: ServiceAccount
metadata:
  name: dashboard-admin
  namespace: kubernetes-dashboard
---
apiVersion: rbac.authorization.k8s.io/v1beta1
kind: ClusterRoleBinding
metadata:
  name: cluster-admin-rolebinding
roleRef:
  apiGroup: rbac.authorization.k8s.io
  kind: ClusterRole
  name: cluster-admin
subjects:
- kind: ServiceAccount
  name: dashboard-admin
  namespace: kubernetes-dashboard
$ kubectl create -f k8s-serviceaccount.yml
After successful creation of the service account, perform the below set of commands:
$ kubectl get sa
$ kubectl describe sa dashboard-admin
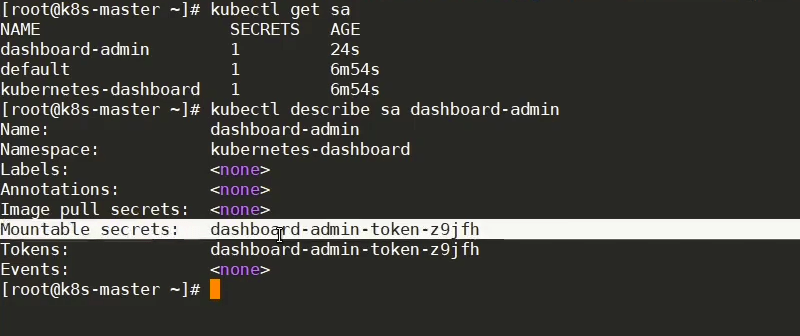
$ kubectl secretes dashboard-admin-token-z9jfh (Varies)
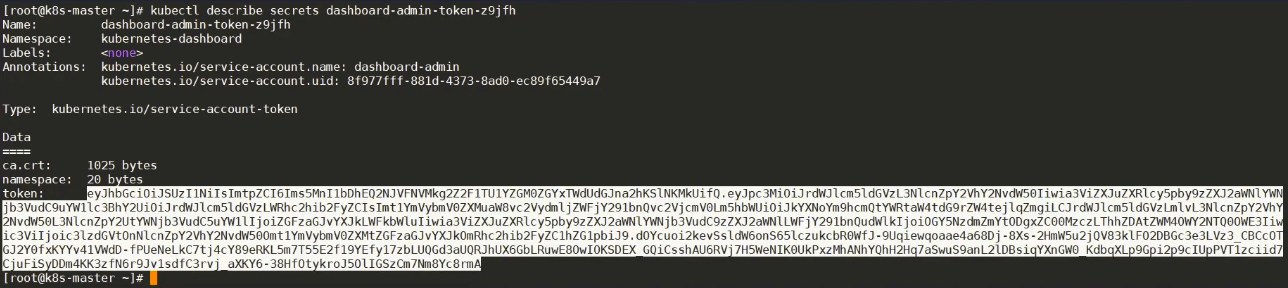
Copy your token and paste it on the login page by selecting the Token option and VOILA!
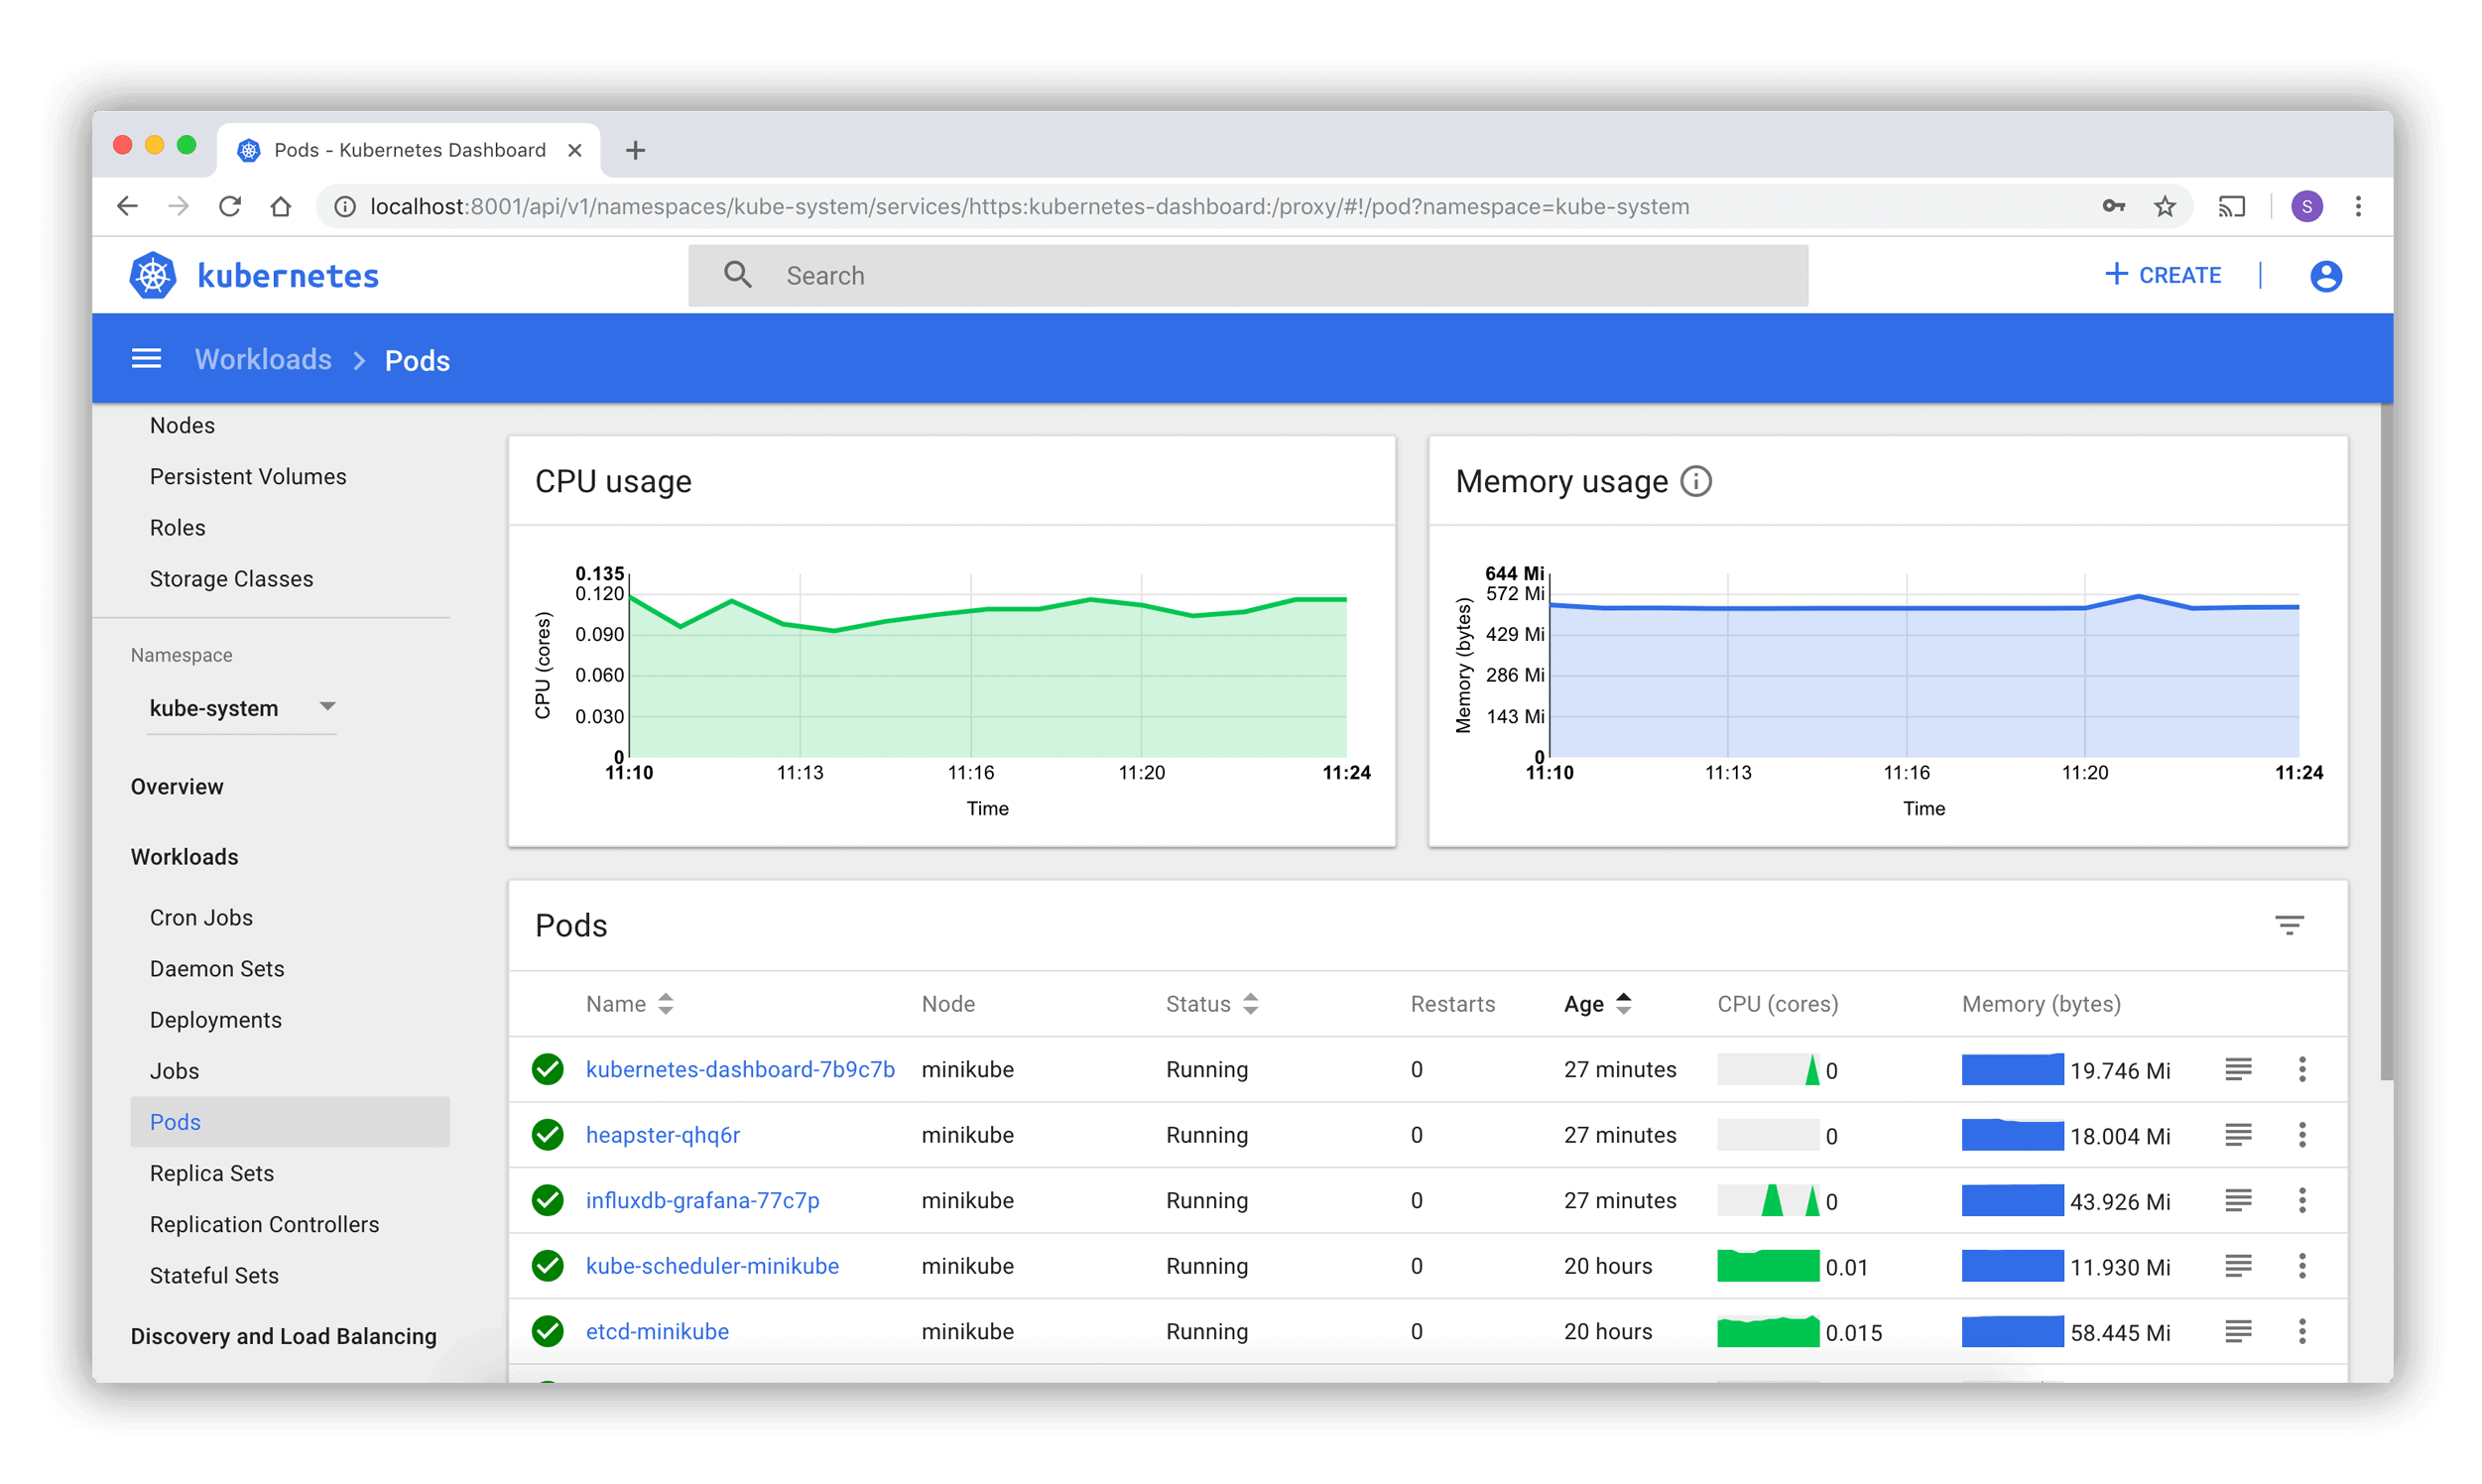
You will successfully login to your Kubernetes dashboard where we have a graphical representation of all the things in our cluster!
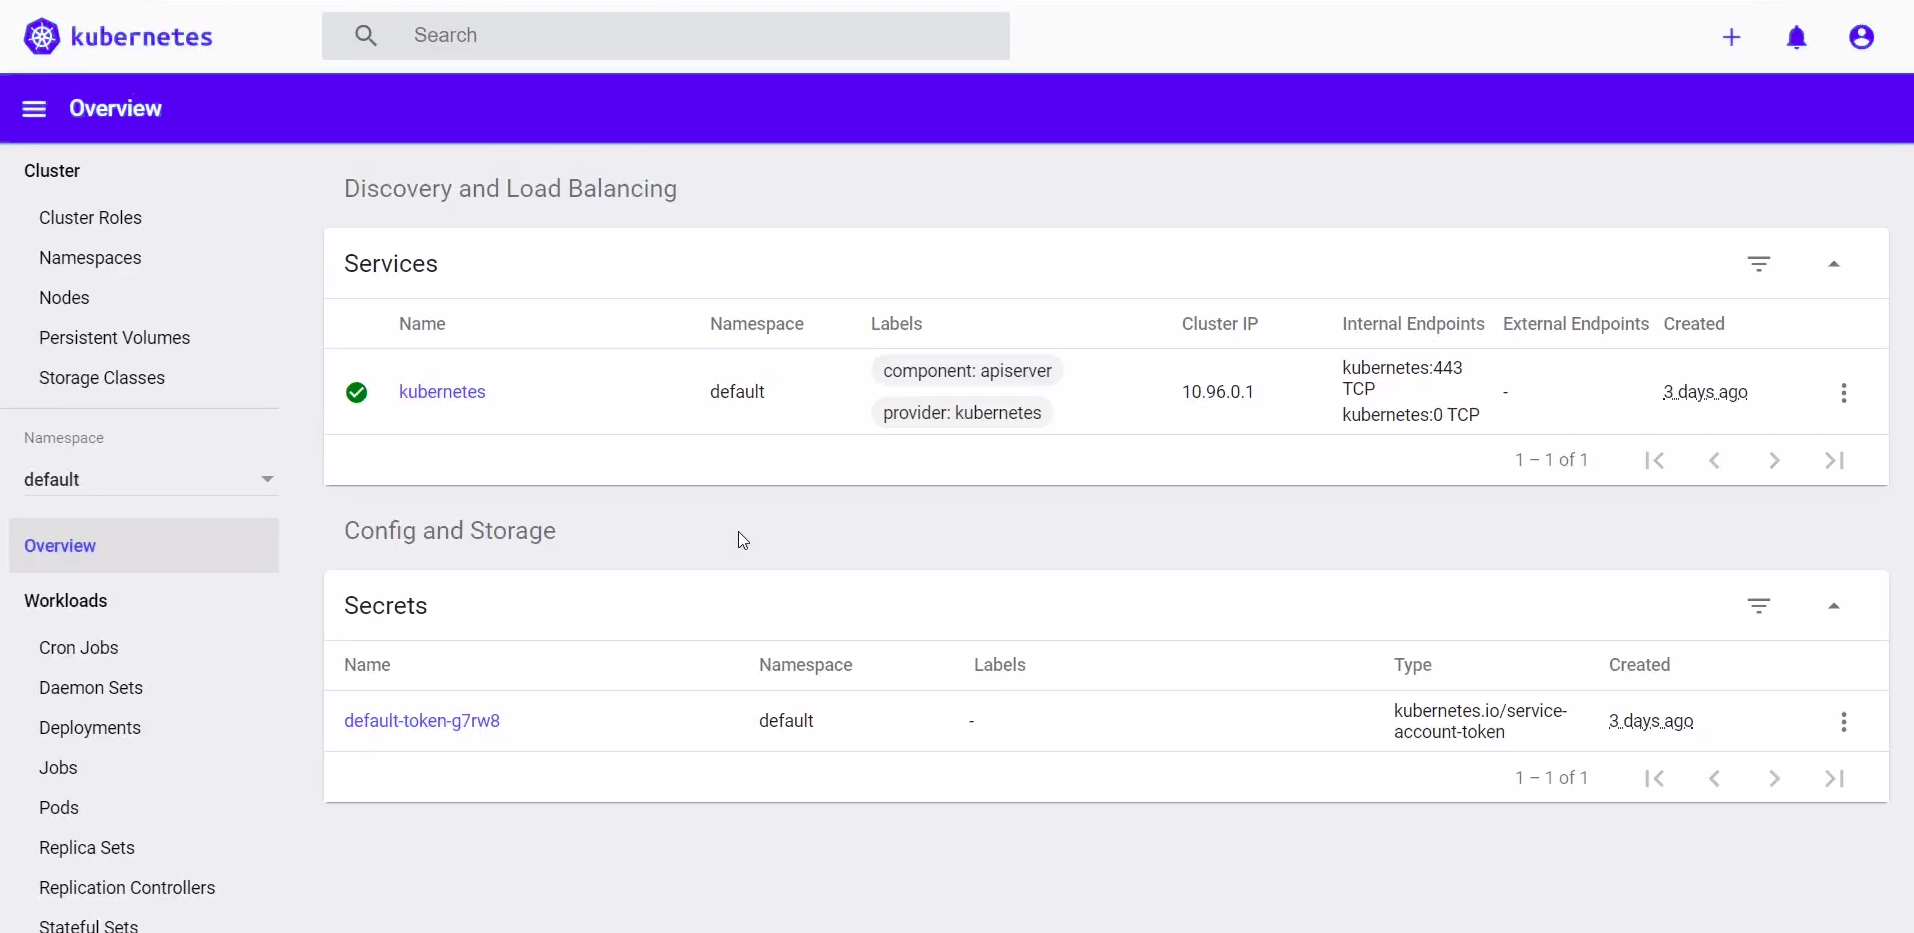
Overview in Default Namespace
Also Check: Our blog post on Kubernetes ingress controller.
Frequently Asked Questions on K8s Dashboard
What is Kubernetes Dashboard?
Kubernetes Dashboard is a web-based user interface that allows users to manage and monitor their Kubernetes clusters. It provides an easy-to-use graphical interface to deploy applications, manage cluster resources, and troubleshoot applications running in the cluster.
How do I access Kubernetes Dashboard?
Kubernetes Dashboard can be accessed by deploying it to your Kubernetes cluster and then using a web browser to navigate to its URL. Typically, this involves using kubectl to apply the Dashboard deployment YAML file and then accessing it via a proxy or an external IP.
How can I securely access K8s Dashboard?
To securely access K8s Dashboard, it is recommended to create a user with limited permissions and use a secure connection (HTTPS). You can set up Role-Based Access Control (RBAC) and create a bearer token for authentication.
How do I manage multiple clusters with Kubernetes Dashboard?
Kubernetes Dashboard does not natively support managing multiple clusters from a single interface. However, you can run separate instances of the Dashboard for each cluster and access them individually.
Related / References:
- Visit our YouTube channel on “Docker & Kubernetes”
- Role-Based Access Control (RBAC)
- Services in Kubernetes
- (CKS) Certification: Step By Step Activity Guides/Hands-On Lab Exercise & Learning Path
- (CKA) Certification: Step By Step Activity Guides/Hands-On Lab Exercise & Learning Path
- GitHub Repo of Kubernetes Dashboard
- For Frequently Asked Questions on CKA & CKAD, click here
Join FREE Masterclass
Discover the Power of Kubernetes, Docker & DevOps – Join Our Free Masterclass. Unlock the secrets of Kubernetes, Docker, and DevOps in our exclusive, no-cost masterclass. Take the first step towards building highly sought-after skills and securing lucrative job opportunities. Click on the below image to Register Our FREE Masterclass Now!
![Microsoft Agentic AI Business Solutions Architect [AB-100] | K21 Academy](https://test.k21academy.com/wp-content/uploads/2025/11/Microsoft-Agentic-AI-Business-Solutions-Architect-AB-100-Exam-Overview1.png)