
![]()
Welcome to our Microsoft Azure Data on Cloud Bootcamp, where we’re dedicated to equipping you with the practical skills needed to excel in today’s job market.
In this blog, we’ll dive into a series of Hands-on Labs and Projects meticulously designed to prepare you for real-world challenges and job interviews. Throughout this journey, you’ll explore a variety of topics essential for mastering data management and analysis on the Azure cloud platform. Our bootcamp offers a structured learning path to cultivate job-ready skills, from foundational concepts to advanced techniques.
Let’s embark on this transformative experience together, unlocking the doors to endless opportunities in the realm of data engineering, scientist and analytics.
This post helps you with Data on the Microsoft Azure journey with your self-paced learning and your team learning. There are 70+ Hands-On Labs in this course.
Table of Contents:
1. Hands-On Labs For Data on Azure Cloud
- Lab 1: Register For A Free Microsoft Azure Cloud Account
- Lab 2: Switch to a pay-as-you-go account
- Lab 3: Create a billing alert using the Azure portal
1.2: Explore fundamentals of relational data in Azure
1.3: Explore fundamentals of non-relational data in Azure
1.4: Explore fundamentals of data analytics
- Lab 7- Explore data analytics in Microsoft Fabric
- Lab 8- Explore real-time analytics in Microsoft Fabric
- Lab 9- Visualize data with Power BI
- Lab 10: Explore Spark Streaming in Azure Synapse Analytics
- Lab 11: Explore Data Analytics in Azure with Azure Synapse Analytics
- Lab 12: Explore Azure Synapse Data Explorer
1.5: Introduction to Azure Synapse Analytics and Serverless SQL Pools
- Lab 30 – Explore Azure Synapse Analytics
- Lab 31 – Query Files using a Serverless SQL Pool
- Lab 32 – Transform files using a serverless SQL pool
- Lab 33 – Analyze data in a lake database
1.6: Perform data engineering with Azure Synapse Apache Spark Pools
- Lab 34 – Analyze data in a data lake with Spark
- Lab 35 – Transform data using Spark in Synapse Analytics
- Lab 36 – Use Delta Lake with Spark in Azure Synapse Analytics
1.7: Data engineering with Azure Databricks
- Lab 37 – Explore Azure Databricks
- Lab 38 – Use Spark in Azure Databricks
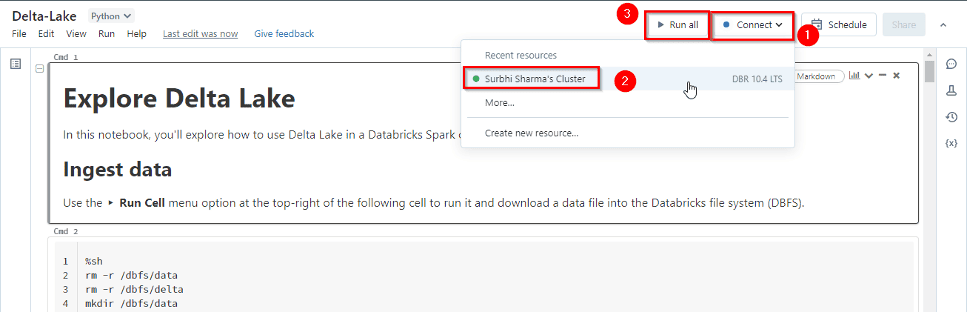
- Lab 39 – Use Delta Lake in Azure Databricks
- Lab 40 – Use a SQL Warehouse in Azure Databricks
- Lab 41 – Run an Azure Databricks Notebook with Azure Data Factory
1.8: Implement a Lakehouse with Microsoft Fabric
- Lab 42 : Create Fabric free trial Account
- Lab 43: How to Create Work Space in Fabric
- Lab 44: Use delta tables in Apache Spark
1.9: Ingest data with Microsoft Fabric
- Lab 44: Create and use a Dataflow Gen2 in Microsoft Fabric
- Lab 45: Ingest data with a pipeline
- Lab 46: Analyze data with Apache Spark
- Lab 47: Explore Real-Time Intelligence in Fabric
- Lab 49: Organize your Fabric lakehouse using a medallion architecture
- Lab 50: Ingest real-time data with Eventstreams in Microsoft Fabric
- Lab 51: Work with data in a Microsoft Fabric event house
1.10: Implement a data warehouse with Microsoft Fabric
- Lab 52: Analyze data in a data warehouse
- Lab 53: Load data into a warehouse in Microsoft Fabric
- Lab 54: Monitor a data warehouse in Microsoft Fabric
- Lab 55: Secure a warehouse in Microsoft Fabric
1.11: Manage a Microsoft Fabric environment
- Lab 56: Implement deployment pipelines in Microsoft Fabric
- Lab 57: Monitor Fabric activity in the Monitor hub
- Lab 58: Secure data access in Microsoft Fabric
1.12: Prepare data in Power BI Desktop
1.13: Model data with Power BI Desktop
- Lab 61 – Model Data in Power BI Desktop
- Lab 62 – Create DAX Calculations in Power BI Desktop – Part 1
- Lab 63 – Create DAX Calculations in Power BI Desktop – Part 2
1.14: Create reports in Power BI Desktop
- Lab 64 – Design a Report in Power BI Desktop – Part 1
- Lab 65 – Design a Report in Power BI Desktop – Part 2
- Lab 66 – Create a Power BI Dashboard
1.15: Data engineering with Azure Databricks
1.16 Get started with the Data Warehouse
- Lab 69: Analyze data in a data warehouse
- Lab 70: Load Data into a Data Warehouse in Microsoft Fabric
- Lab 71: Query a data warehouse in Microsoft Fabric
- Lab 72: Monitor a data warehouse in Microsoft Fabric
- Lab 73: Secure a Microsoft Fabric data warehouse
- Lab 74: Explore data for data science with notebooks in Microsoft Fabric
1.17: Work with semantic models in Microsoft Fabric
- Lab 75: Create DAX calculations in Power BI Desktop
- Lab 76: Design scalable semantic models
- Lab 77: Create reusable Power BI assets
- Lab 78: Enforce semantic model security
1.18: Administer and govern Microsoft Fabric
- Lab 79: Get Started with Real-Time Intelligence in Microsoft Fabric
- Lab 80: Secure data access in Microsoft Fabric
- Project 1: Design a dashboard with a basic set of visualizations and DAX queries
- Project 2: Transform Data by Using Azure Data Factory
- Project 3: Tokyo Olympics Insights
- Project 4: End-to-end Azure data engineering Project in the Formula One dataset
- Project 5: Analyse the Streaming Transportation Data
- Project 6: COVID-19 Data Insights using ADF & Power BI
- Project 7: Toys Sales Revenue Analysis

Download Data on Azure Cloud Bootcamp Brochure
1. Hands-On Labs For Data on Azure Cloud
1.1 Azure Basics labs
1) Register For A Free Microsoft Azure Cloud Account
Creating a Microsoft Azure free account is one way to access Azure services. When you start using Azure with a free account, you get USD2001 credit to spend in the first 30 days after you sign up. In addition, you get free monthly amounts of two groups of services: popular services, which are free for 12 months, and more than 25 other services that are always free.

2. Switch to a Pay-as-you-go account
The pay-as-you-go subscription model is a pricing strategy where customers pay only for the resources they use. This is in contrast to traditional subscription models, where customers are charged a fixed monthly or annual fee regardless of their usage.
The PAYG model is becoming increasingly popular for a number of reasons. First, it gives customers more flexibility and control over their spending. Customers can scale their usage up or down as needed, and they only pay for what they use.
Second, the PAYG model can help businesses to reduce their upfront costs. Businesses do not need to commit to a long-term contract or purchase a large upfront license fee. This can free up capital for other business needs.
3. Create a billing alert using the Azure portal
Azure billing alerts allow you to monitor your Azure spending and receive notifications when your spending exceeds a certain threshold. This can help you to avoid unexpected costs and stay within your budget.
Billing alerts are based on the following concepts:
- Threshold: A threshold is a value that you specify. When your Azure spending exceeds the threshold, the alert will be triggered.
- Frequency: The frequency is how often the alert condition is evaluated. You can choose to evaluate the alert condition every hour, day, week, or month.
- Alert actions: Alert actions are the steps that are taken when the alert is triggered. You can choose to send an email notification, create an Azure Monitor alert, or call a webhook
1.2 Azure Data Fundamental [DP-900]
1.2.1: Explore fundamentals of relational data in Azure
Lab 4 – Explore Azure SQL Database
This Activity Guide Covers Steps for provisioning an Azure SQL Database resource in your Azure subscription, and then use SQL to query the tables in a relational database.

1.2.2: Explore fundamentals of non-relational data in Azure
Lab 5- Explore Azure Storage
In this guide, we’ll explore these services in more detail and show you how to work with Azure Storage effectively, whether you’re managing files, building data lakes, or developing cloud-native applications.

Lab 6- Explore Azure Cosmos DB
Azure Cosmos DB is a globally distributed, multi-model database service designed for high availability, low latency, and seamless scalability. It supports various data models like JSON documents, Gremlin graphs, and key-value pairs. With global distribution, five consistency levels, and horizontal scaling via partitioning, it empowers developers to build responsive applications. This guide covers key concepts, querying data, security, performance tuning, and a step-by-step setup tutorial, equipping you to leverage Cosmos DB’s capabilities for modern, distributed applications across diverse use cases.

1.2.3: Explore fundamentals of data analytics
Lab 7- Explore data analytics in Microsoft Fabric
Microsoft Fabric is a unified data analytics platform that helps organizations bring all their data teams together, simplify data integration, empower everyone with valuable insights, and boost productivity with copilot experiences. It offers a comprehensive suite of services, including data lake, data engineering, and data integration, all in one place.

Lab 8- Explore real-time analytics in Microsoft Fabric
Real-time analytics in Microsoft Fabric allows you to process and analyze data as it is generated, providing immediate insights for time-sensitive decision-making. By leveraging services like Azure Stream Analytics and Apache Spark Structured Streaming, Microsoft Fabric enables the ingestion, processing, and visualization of data in real-time from various sources such as IoT devices, logs, and transactional systems.
With this capability, users can monitor key metrics, detect anomalies, and respond quickly to changing conditions. Real-time analytics in Microsoft Fabric seamlessly integrates with other Azure services, such as Power BI, to deliver dynamic and interactive dashboards that reflect the most current data, empowering businesses to make data-driven decisions instantly.

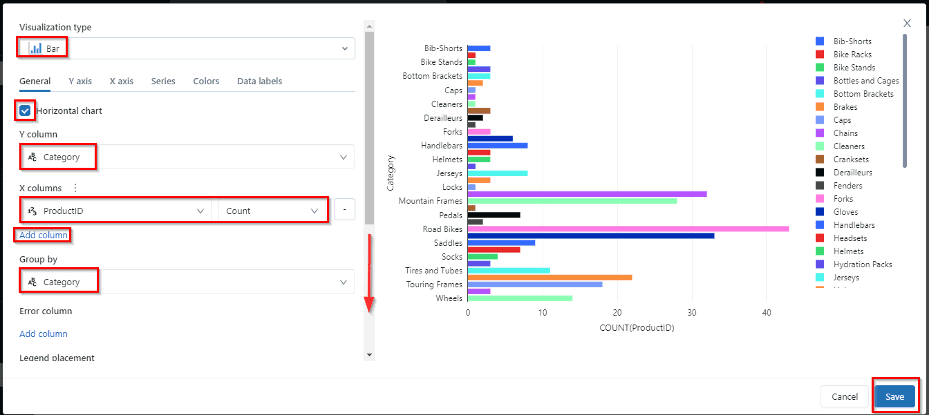
Lab 9- Visualize data with Power BI
Power BI in Microsoft Fabric allows users to create interactive and insightful data visualizations from their datasets. By connecting to various data sources such as Azure Data Lake, SQL databases, and Apache Spark, users can build comprehensive dashboards and reports that highlight key business metrics.
Power BI’s rich visualization tools, including charts, graphs, and maps, enable users to explore data trends and patterns with ease. In Microsoft Fabric, the integration between Power BI and data stored in Azure ensures that the visualizations are always up-to-date, providing a powerful tool for decision-making. With Power BI, you can share real-time insights across teams, enhancing collaboration and supporting data-driven strategies.

1.2.4 : Explore fundamentals of data analytics
Lab 10: Explore Spark Streaming in Azure Synapse Analytics
Spark Streaming in Azure Synapse Analytics enables real-time data processing and analytics on streaming data, allowing users to process live data from sources such as IoT devices, event hubs, or logs. With Apache Spark, you can ingest, transform, and analyze large volumes of real-time data in a scalable and distributed environment. By integrating Spark Streaming into Azure Synapse Analytics, you can seamlessly combine batch and stream processing, providing a unified analytics platform.
This allows you to detect trends, perform real-time aggregations, and trigger automated actions based on streaming data. Spark Streaming in Synapse provides a powerful solution for real-time analytics, helping organizations respond to data-driven insights instantly and make timely, informed decisions.

Lab 11: Explore Data Analytics in Azure with Azure Synapse Analytics
Azure Synapse Analytics is an integrated analytics platform that combines big data and data warehousing capabilities in Azure. With Synapse Analytics, you can ingest, explore, and analyze data from multiple sources, including relational and non-relational data stores. By integrating services like Apache Spark, SQL pools, and Power BI, Synapse enables seamless data preparation, transformation, and visualization at scale.
You can perform complex queries, run machine learning models, and generate insights from vast datasets in a unified workspace. Azure Synapse Analytics simplifies large-scale data analytics, making it easier to explore and analyze big data in real-time, providing organizations with the tools to make faster, data-driven decisions.

Lab 12: Explore Azure Synapse Data Explorer
Azure Synapse Data Explorer is a fast and scalable data exploration service that allows users to query large volumes of structured and unstructured data. Built on top of Azure Data Explorer, it provides powerful capabilities for analyzing logs, telemetry, and time-series data in real-time. With Synapse Data Explorer, you can ingest, query, and visualize data from multiple sources, including Azure Data Lake, SQL databases, and event streams.
The service is optimized for high-performance querying, offering fast and interactive analysis of large datasets. By integrating with Azure Synapse Analytics, users can perform advanced analytics, detect trends, and gain insights from complex data with ease, making it an essential tool for modern data analytics and monitoring workflows.

Related Reading: Microsoft Azure Data Fundamentals [DP-900]: Step By Step Activity Guides (Hands-On Labs)
1.3 AZ-900 [Microsoft Azure Fundamentals]
Lab 13: Register For Azure Free Trial Account
The first thing you must do is to get a Trial Account for Microsoft Azure. (You get 200 USD FREE Credit from Microsoft to practice)
Microsoft Azure is one of the top choices for any organization due to its freedom to build, manage, and deploy applications. Here, we will look at how to register for the Microsoft Azure FREE Trial Account. Click here.
Note: Get this first step-by-step activity guide FREE from here
After you register for a Microsoft Cloud Trial Account, you should get an Email Like the below from Microsoft:

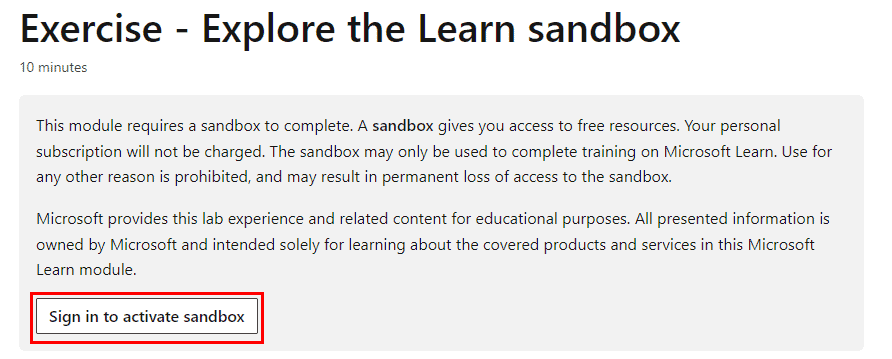
Lab 14: Explore the learn Sandbox
Azure Sandbox is an ideal way for developers and other IT professionals to gain hands-on experience with Azure, without the need for costly hardware or infrastructure. It also enables organisations to evaluate new Azure features and services before implementing them in their production environment.
Lab 15: Create an Azure Resource
In this lab , you’ll use the Azure portal to create a resource. The focus of the exercise is observing how Azure resource groups populate with created resources.
These resources include:
- Resource Group
- VNet
- Virtual Machine
- Public IP

Lab 16: Create A Virtual Machine In The Azure Portal
Azure Virtual Machines (VM) is one of several types of on-demand, scalable computing resources that Azure offers. Typically, you choose a VM when you need more control over the computing environment than the other choices offer.
This Guide gives you information about what you should consider before you create a VM, how you create it, and how you manage it. An Azure VM gives you the flexibility of virtualization without having to buy and maintain the physical hardware that runs it. However, you still need to maintain the VM by performing tasks, such as configuring, patching, and installing the software that runs on it.
This guide gives you step-by-step information on how to create a Virtual Machine on the Azure cloud and install and run an IIS Web Server.

Also check: Capex vs Opex, know their major differences!
Lab 17: Create A Virtual Network
Azure Virtual Network (VNet) is the fundamental building block for your private network in Azure. VNet enables many types of Azure resources, such as Azure Virtual Machines (VM), to securely communicate with each other, the internet, and on-premises networks. VNet is similar to a traditional network that you’d operate in your data center but brings with it additional benefits of Azure’s infrastructure such as scale, availability, and isolation.
In this activity guide, we will create an Azure Virtual Network, connect two virtual machines to the VNet, and test the connection between them.
 Check out: Microsoft Azure provides governance features and services
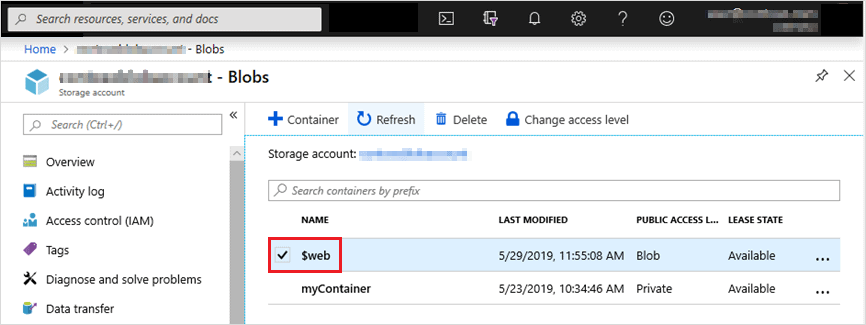
Lab 18: Create Blob Storage
Microsoft Azure Storage provides massively scalable, durable, and highly available storage for data on the cloud, and serves as the data storage solution for modern applications.
This activity guide gives you step-by-step information on how to connect to Blob Storage to perform various operations such as create, update, get, and delete blobs in your Azure Storage account.
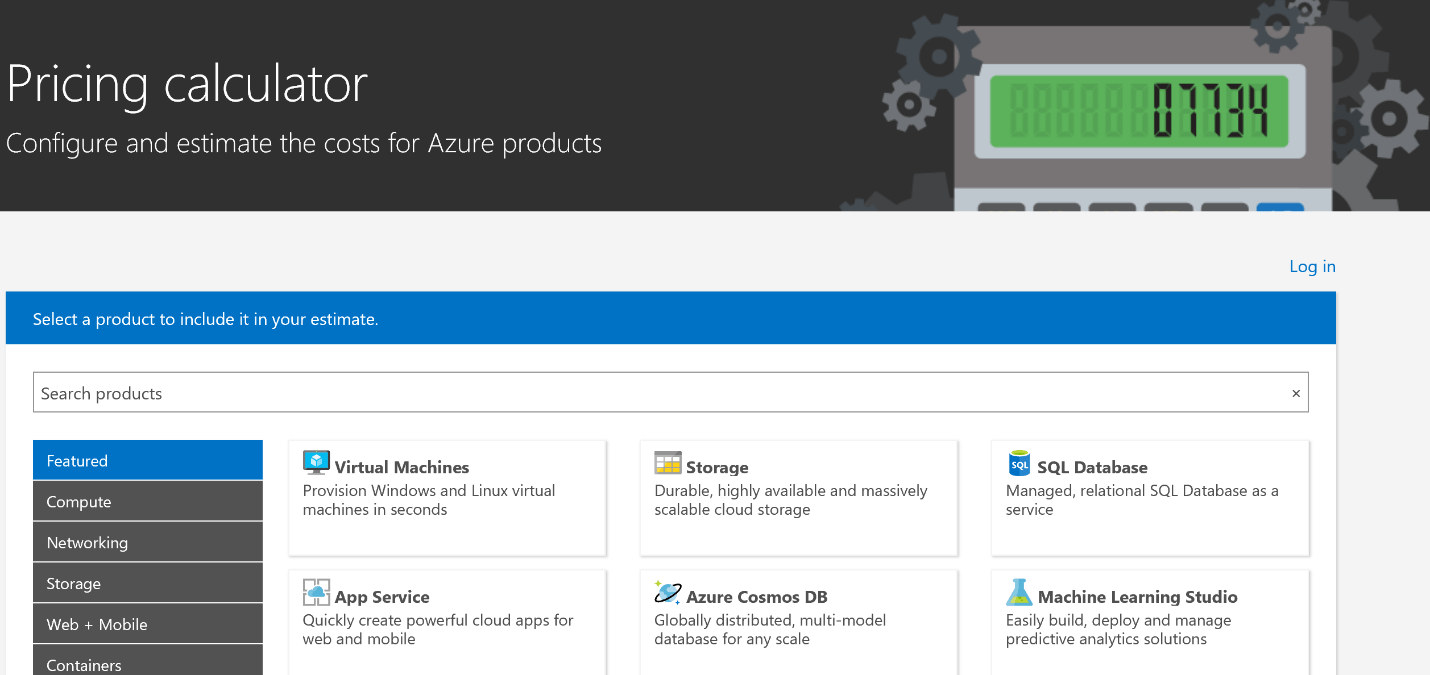
Lab 19: Use The Azure Pricing Calculator
This activity guide gives you a step-by-step process of estimating the cost of hosting a sample infrastructure by using the Azure Pricing Calculator.
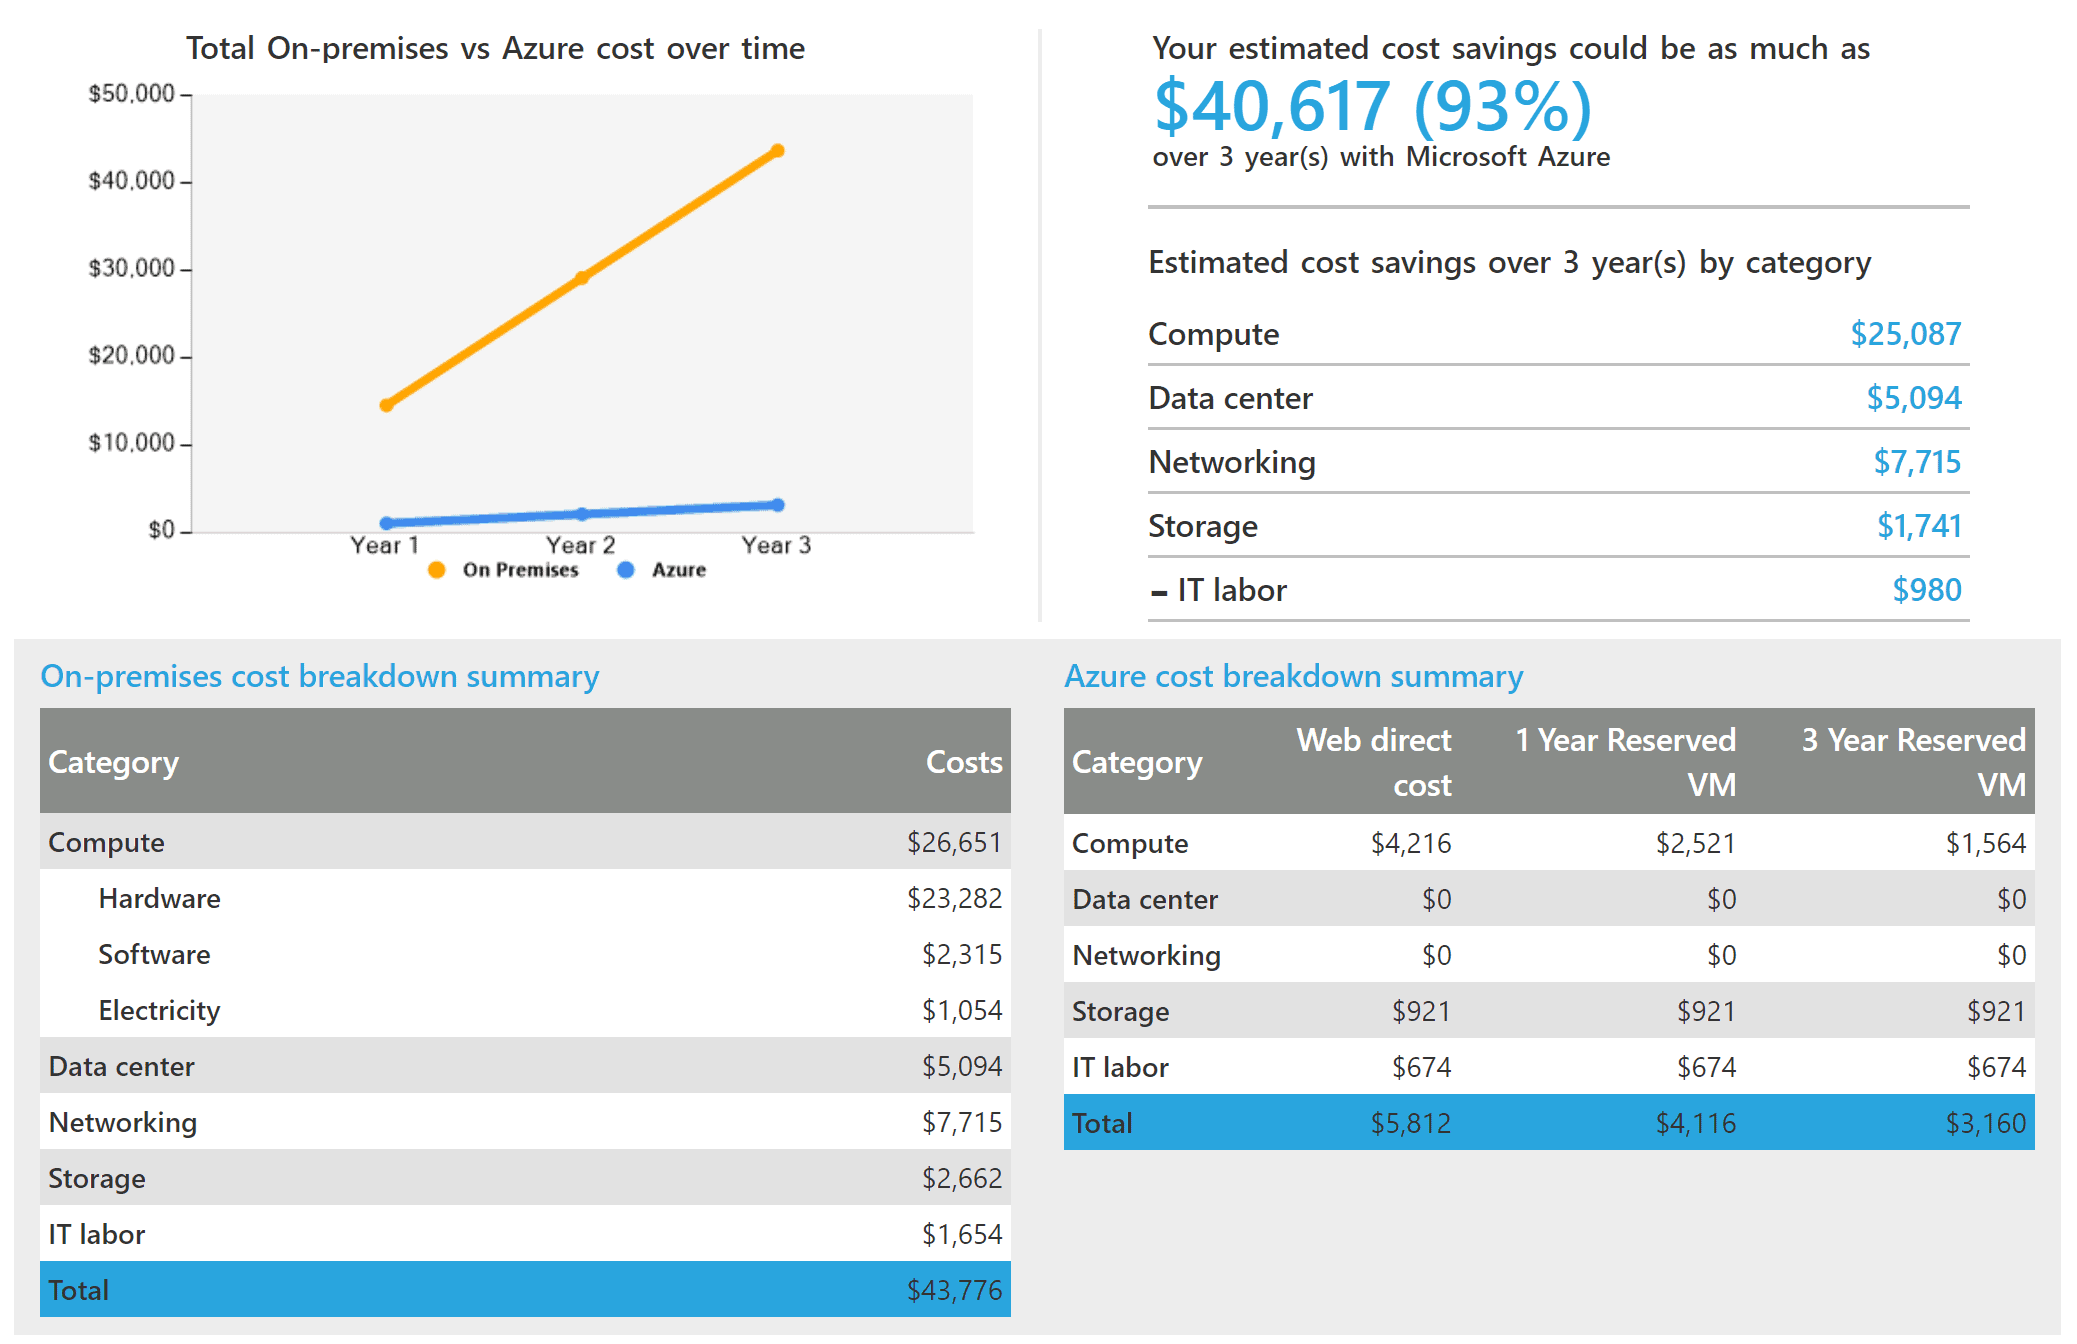
Lab 20: Use the Azure TCO Calculator
In this guide, we will be using the Total Cost of Ownership Calculator to compare and measure the costs of hosting a sample infrastructure On-premises Vs on the Azure cloud.
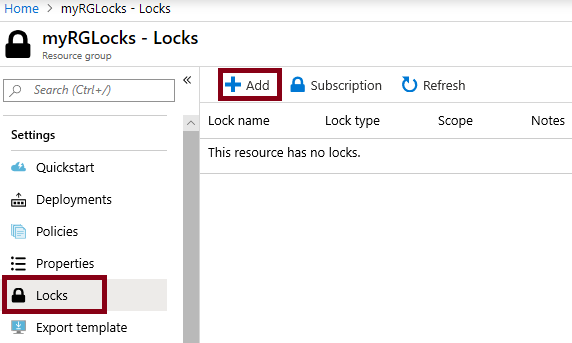
Lab 21: Manage Resource Locks
As an administrator, you may need to lock a subscription, resource group, or resource to prevent other users in your organization from accidentally deleting or modifying critical resources. You can set the lock level to CanNotDelete or ReadOnly. In the portal, the locks are called Delete and Read-only respectively.
In this walkthrough, we will create a resource group, add a lock to the resource group and test deletion, test deleting a resource in the resource group, and remove the resource lock.
Lab 22: Deploy Azure Container Instances
Azure Container Instances (ACI) provide a fast and easy way to run containers in Azure without needing to manage virtual machines or complex orchestrators like Kubernetes. With ACI, you can quickly deploy and scale containerized applications on demand. In this lab, you will learn how to deploy a containerized application using Azure Container Instances by specifying the container image, configuring resources like CPU and memory, and managing the container lifecycle.

ACI supports various container images, including Docker and other open-source formats. This solution is ideal for lightweight, stateless applications, batch jobs, or development and testing environments, offering fast deployment with pay-as-you-go pricing. Deploying containers with Azure Container Instances simplifies container management, allowing you to focus on your application rather than the infrastructure.
Lab 23: Implement an Azure IoT Hub
Azure IoT Hub is a fully managed service that enables secure and scalable communication between Internet of Things (IoT) devices and cloud-based applications. In this lab, you will learn how to set up an Azure IoT Hub, register IoT devices, and securely send data from these devices to the cloud. You will explore how to configure the IoT Hub to manage device identities, monitor device-to-cloud communication, and implement device-to-cloud data ingestion.

Azure IoT Hub provides powerful features such as device provisioning, bi-directional communication, and secure authentication to help you build scalable IoT solutions. By integrating with services like Azure Stream Analytics or Azure Functions, IoT Hub can process and analyze data in real-time, enabling organizations to make data-driven decisions based on IoT data.
Lab 24: Create a VM with a Template
Creating a Virtual Machine (VM) with a template in Azure allows you to deploy a pre-configured VM environment quickly and consistently. In this lab, you will learn how to use an Azure Resource Manager (ARM) template to automate the deployment of a VM. The template specifies the configuration of the VM, such as the operating system, storage options, network settings, and resource allocation.
By using templates, you ensure that every VM deployment is standardized, making it easier to scale and manage large environments. This method is ideal for creating multiple VMs with identical configurations across different environments or regions, saving time and reducing manual errors in the setup process. With ARM templates, you can deploy VMs on-demand and integrate them into broader infrastructure automation workflows.

Lab 25: Create a VM with PowerShell
In this lab, you will learn how to create a Virtual Machine (VM) in Azure using PowerShell. PowerShell is a powerful scripting tool that allows you to automate the deployment of resources on Azure. By using the Azure PowerShell module, you can create and configure VMs programmatically. This approach is ideal for automating the deployment of multiple VMs, integrating VM provisioning into your automation workflows, or performing bulk resource management.

In this lab, you will cover tasks such as setting up the VM’s networking, storage, and operating system configurations directly from the PowerShell command line. This method allows for greater flexibility and repeatability in creating VMs, making it a key tool for Azure administrators.
Lab 26: Implement Azure Key Vault
Azure Key Vault is a cloud service used to securely store and manage sensitive information such as secrets, keys, and certificates. In this lab, you will learn how to implement Azure Key Vault to safeguard your application secrets and sensitive data. You will create a Key Vault, add secrets (e.g., API keys, connection strings), and configure access policies to control who can access these secrets. Azure Key Vault also integrates with Azure Active Directory to ensure secure access.

Additionally, you will explore how to use Key Vault in applications, automating secret management in a secure manner, and integrating with other Azure services. By implementing Azure Key Vault, you ensure that your applications have a centralized and secure location to manage credentials and sensitive data, helping to reduce the risk of security breaches.
Lab 27: Manage Access with RBAC
Role-Based Access Control (RBAC) in Azure allows you to assign specific permissions to users, groups, and applications to control access to resources. In this lab, you will learn how to manage access to Azure resources using RBAC. You will assign roles to users or service principals, ensuring they have the necessary permissions to perform specific tasks.

The built-in roles like Owner, Contributor, and Reader will be explored, and you will also learn how to create custom roles for more granular access control. By using RBAC, you ensure that only authorized users have the appropriate level of access to Azure resources, following the principle of least privilege and improving security and compliance across your Azure environment.
Lab 28: Explore the Trust Center
The Azure Trust Center provides detailed information about the security, privacy, and compliance features of Microsoft Azure. In this lab, you will explore the Trust Center to understand how Microsoft ensures the security and compliance of its cloud services. You will learn about Azure’s security framework, data protection policies, and the global compliance certifications that Azure meets, such as GDPR, ISO 27001, and SOC 2.

The Trust Center also offers resources on how Microsoft handles customer data, maintains transparency, and ensures high availability. By exploring the Trust Center, you will gain insights into how Azure helps organizations meet their security and regulatory requirements, making it a key resource for businesses concerned about compliance and data protection.
Lab 29: Access Azure preview features
Azure offers preview features to allow users to test and explore new capabilities before they are generally available. In this lab, you will learn how to access and enable Azure preview features through the Azure Portal. You will explore how to sign up for previews, activate new features, and provide feedback to Microsoft about their performance. Preview features are often released for testing, giving users the chance to try out cutting-edge functionality, such as new services, APIs, or configurations, before they are officially rolled out.

It’s important to note that these features may not be fully supported and could change during their development. By accessing Azure’s preview features, you stay ahead of the curve, gaining early access to innovative tools and capabilities.
1.4 Azure Data Engineer
1.4.1 : Introduction to Azure Synapse Analytics and Serverless SQL pools
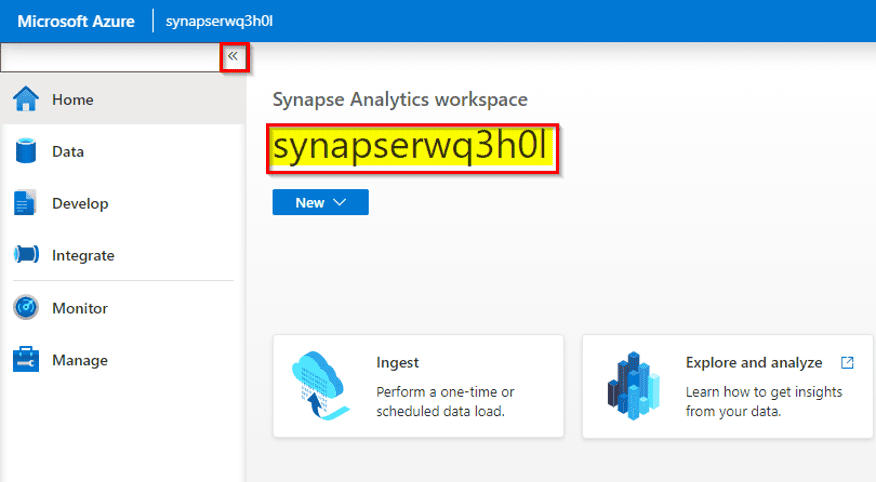
Lab 30- Explore Azure Synapse Analytics
In the competitive world of retail, staying ahead of the curve is essential. As the Sr. Data Engineer of a growing retail company called “Fashion Forward,” you’re faced with the challenge of making data-driven decisions in a rapidly changing market. To meet this challenge, you decide to explore Azure Synapse Analytics, a promising solution in the Microsoft Azure ecosystem
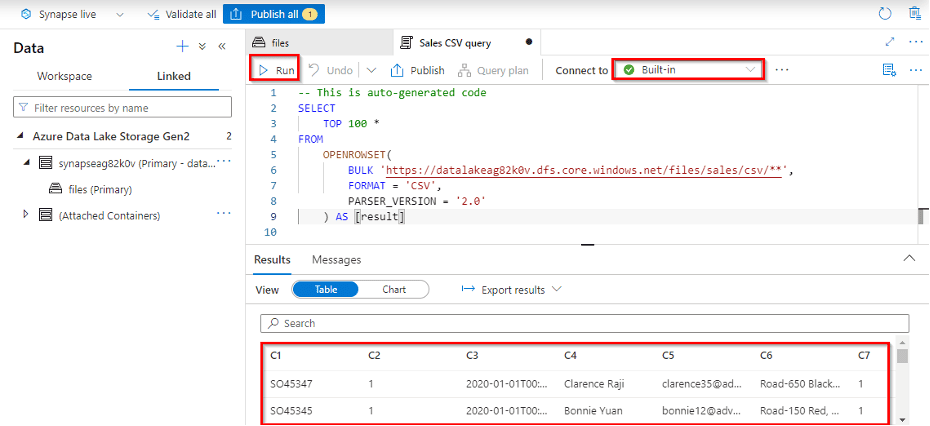
Lab 31- Query Files using a Serverless SQL Pool
In today’s data-driven business landscape, organizations rely heavily on data analysis to make informed decisions. As the Head of Data Analytics at “TechCo,” a rapidly expanding technology company, you are tasked with finding an efficient way to analyze large volumes of data without the complexities of managing infrastructure. To address this challenge, you decide to leverage Serverless SQL Pools within Microsoft Azure Synapse Analytics for querying files and extracting valuable insights.
Lab 32 – Transform files using a serverless SQL pool
In today’s data-centric business environment, organizations often face the challenge of efficiently transforming large volumes of data to extract valuable insights. As the Director of Data Engineering at “DataTech Solutions,” a data-focused company, you are tasked with finding a scalable and cost-effective solution for data transformation. To meet this challenge, you decide to utilize Serverless SQL Pool within Azure Synapse Analytics for transforming files and enhancing data quality.
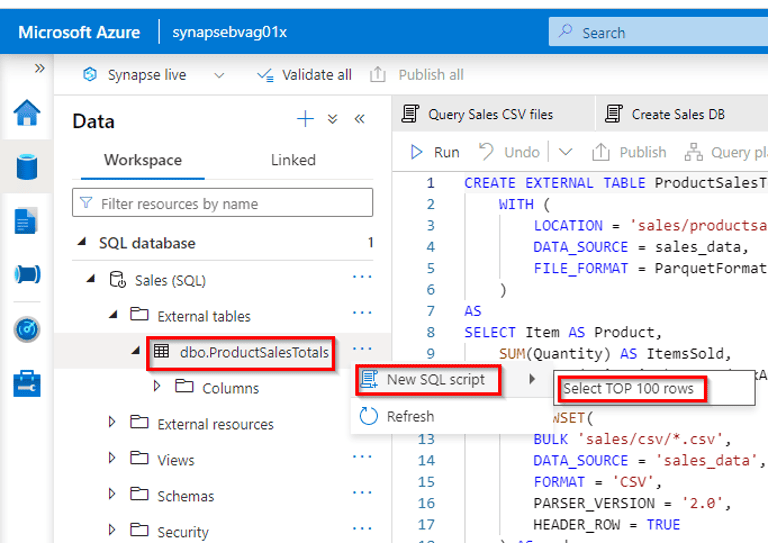
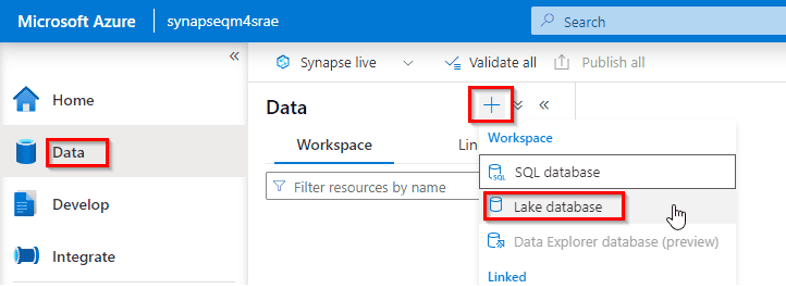
Lab 33 – Analyze data in a lake database
In today’s data-driven business environment, organizations are continually looking for ways to harness the power of their data for insights and decision-making. As the Chief Analytics Officer (CAO) of a global retail conglomerate called “RetailX,” you recognize the importance of analyzing vast amounts of data stored in your data lake database. To derive valuable insights and drive data-centric strategies, you embark on a journey to analyze data in your data lake database.
1.4.2 : Perform data engineering with Azure Synapse Apache Spark Pools
Lab 34- Analyze data in a data lake with Spark
In today’s data-centric business landscape, organizations are continuously seeking ways to unlock the insights hidden within their vast repositories of data. As the Chief Data Officer (CDO) of “DataInsights Corp,” a leading data analytics company, you recognize the importance of harnessing the power of big data technologies. To extract valuable insights and drive data-centric strategies, you embark on a journey to analyze data in your data lake using Apache Spark.
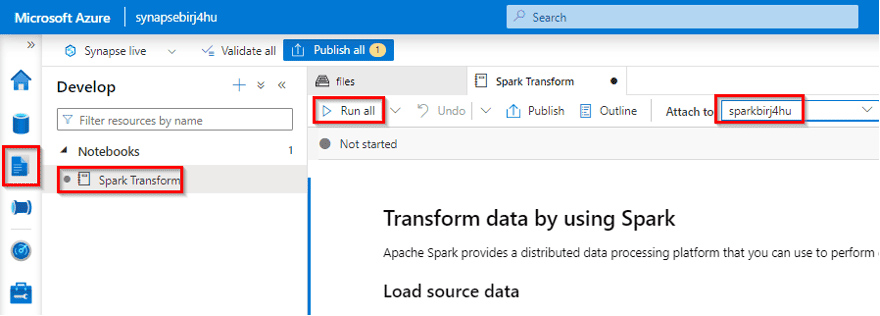
Lab 35 – Transform data using Spark in Synapse Analytics
Data engineers often use Spark notebooks as one of their preferred tools to perform extract, transform, and load (ETL) or extract, load, and transform (ELT) activities that transform data from one format or structure to another
As the Chief Data Officer (CDO) of “TechSolutions Inc.,” a prominent technology firm, you recognize the importance of efficient data transformation. To address this need, you embark on a journey to transform data using Apache Spark within Microsoft Azure Synapse Analytics, a powerful platform for data integration and analytics.
In this exercise, you’ll use a Spark notebook in Azure Synapse Analytics to transform data in files
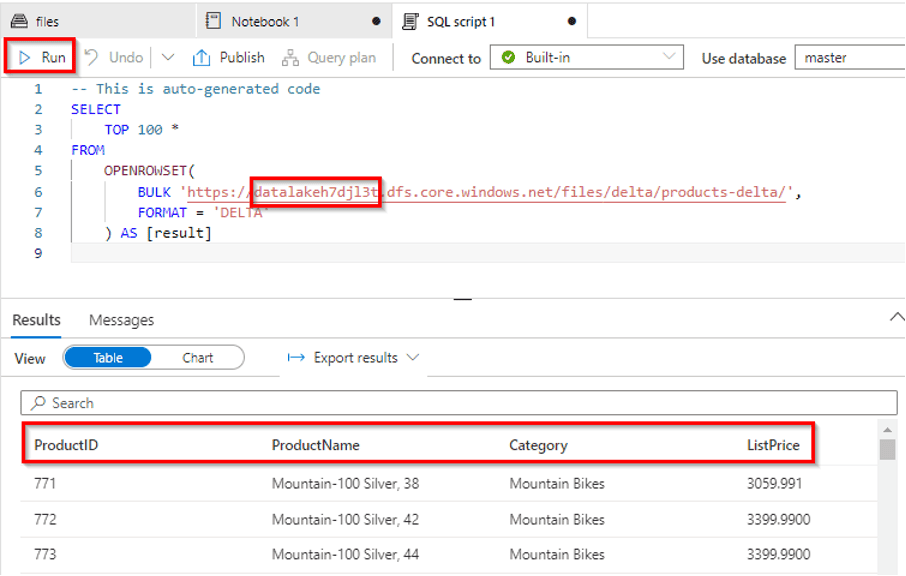
Lab 36 – Use Delta Lake with Spark in Microsoft Azure Synapse Analytics
In the era of data-driven decision-making, companies are constantly seeking ways to improve data processing, storage, and analytics. As the Chief Data Officer (CDO) of a global financial institution named “FinTechCorp,” you face the challenge of managing vast volumes of financial data securely and efficiently. To address these needs, you decide to leverage Delta Lake with Spark within Azure Synapse Analytics, a powerful combination for modern data processing.
1.4.3 : Data engineering with Azure Databricks
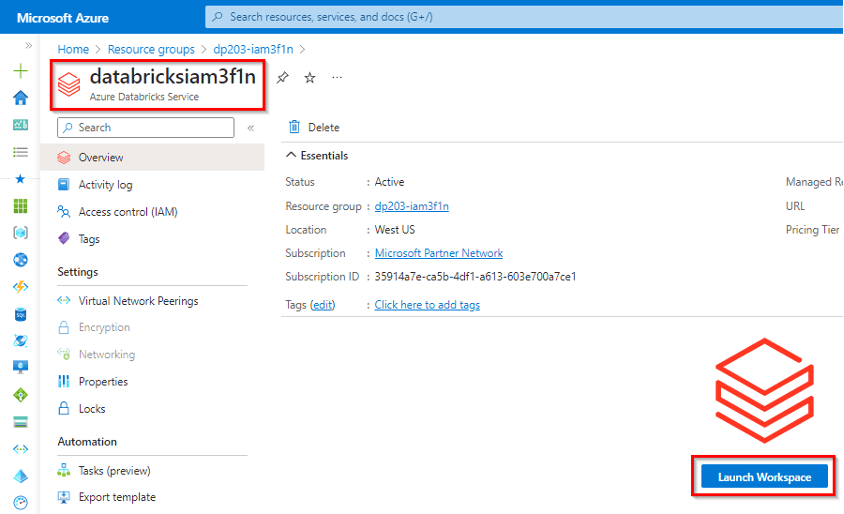
Lab 37- Explore Azure Databricks
In today’s data-driven business landscape, organizations are constantly seeking ways to gain deeper insights from their data. As the Data Engineer of “TechInsights,” a dynamic technology company, you recognize the need for a robust platform to analyze and derive value from diverse datasets. To address this need, you decide to explore Azure Databricks, a powerful analytics platform that combines the best of Apache Spark with Azure cloud capabilities.
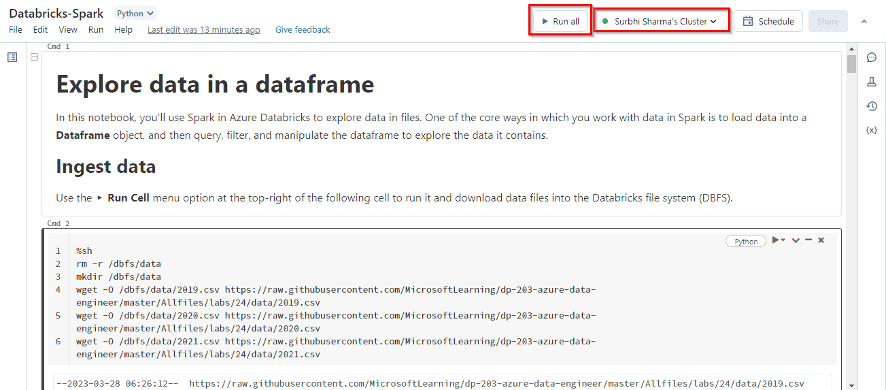
Lab 38 -Use Spark in Azure Databricks
In today’s data-driven landscape, organizations are continually seeking ways to unlock the insights hidden within their massive datasets. As the Data Engineer of “DataTech Enterprises,” a dynamic data-focused company, you recognize the importance of leveraging cutting-edge technologies for data analytics. To meet this demand, you decide to utilize Apache Spark within Azure Databricks, a high-performance analytics platform, to empower your data analytics team.
Lab 39 – Use Delta Lake in Azure Databricks
In today’s data-driven world, organizations are continually seeking ways to streamline data management, improve data quality, and enhance analytics capabilities. As the Chief Technology Officer (CTO) of a fast-growing e-commerce company named “ShopifyX,” you’re faced with the challenge of managing and analyzing diverse data sources. To address these challenges, you decide to implement Delta Lake within Azure Databricks, a powerful combination for data lake management and analytics.
Lab 40- Use a SQL Warehouse in Azure Databricks
In today’s data-driven business landscape, organizations need to make informed decisions in real-time to stay competitive and responsive. As the Chief Data Officer (CDO) of “DataInsights Corp,” a forward-thinking data-driven company, you recognize the importance of real-time reporting and analytics. To empower your organization with immediate business insights, you initiate a project to create real-time reports using Azure Stream Analytics in conjunction with Microsoft Power BI, enabling real-time data visualization and decision-making.
Lab 41- Automate an Azure Databricks Notebook with Azure Data Factory
In today’s data-centric world, organizations rely on efficient data processing to extract insights and drive informed decision-making. As the Chief Data Officer (CDO) of “DataOps Solutions,” an innovative data-focused company, you understand the importance of automating data workflows. To enhance productivity and enable seamless data processing, you initiate a project to automate an Azure Databricks Notebook with Azure Data Factory, streamlining data transformation and analysis.
1.5 DP-700 [Microsoft Fabric Engineer]
Lab 42 : Create Fabric free trial Account
To begin using Microsoft Fabric, the first thing you need to do is create a Fabric free trial account. With this account, you will receive free credits to explore and experiment with the features of Microsoft Fabric, enabling you to build, manage, and deploy data-driven applications seamlessly.
 Microsoft Fabric offers a unified experience for data integration, analytics, and business intelligence. Creating a free trial account allows you to experience these capabilities without incurring immediate costs, and it’s an essential step for getting started with Fabric.
Check out this blog: How to create a Free Trial Account for Microsoft Fabric in 2025
Lab 43: How to Create Work Space in Fabric
Creating a workspace in Microsoft Fabric is the first step to organizing your data, models, and reports. A workspace acts as a container for all your data-related activities, providing a centralized location for collaboration and management. In this lab, you will learn how to create a new workspace in Microsoft Fabric and configure it for your team’s needs. You will explore how to define the workspace’s security settings, assign roles and permissions using Role-Based Access Control (RBAC), and manage data access.

Workspaces in Fabric allow for efficient collaboration, as they centralize resources like dataflows, notebooks, and semantic models. By setting up workspaces, you ensure a structured environment where team members can access, analyze, and collaborate on data securely.
Check out this blog: How to Create a Microsoft Fabric Workspace
Lab 44: Create and use a Dataflow Gen2 in Microsoft Fabric
Dataflow Gen2 in Microsoft Fabric enables users to efficiently design, manage, and transform data using a visual interface without needing to write complex code. It offers enhanced performance, scalability, and optimization features, making it ideal for processing large datasets. With Dataflow Gen2, users can extract data from multiple sources, apply transformations such as filtering, aggregation, and joining, and load the transformed data into various destinations like Azure SQL Database or Azure Data Lake.

It integrates seamlessly with services like Power BI and Azure Synapse Analytics, allowing for streamlined data analytics and reporting. By leveraging Dataflow Gen2, users can create and automate data pipelines, enabling efficient data management and integration within Microsoft Fabric.
Lab 45: Ingest data with a pipeline
Ingesting data with a pipeline in Microsoft Fabric allows you to automate the process of extracting, transforming, and loading (ETL) data from various sources into a unified data store. A pipeline in Microsoft Fabric can connect to multiple data sources, including databases, storage accounts, and APIs, enabling seamless data ingestion. By using pipelines, users can automate data workflows, ensuring that data is consistently and efficiently transferred to the desired destination for further processing and analysis.

This functionality supports both batch and real-time data ingestion, allowing for flexible and scalable data integration solutions that can be integrated with other Microsoft services like Azure Data Lake, SQL Database, and Power BI for analytics and reporting.
Related Readings: Modern Data Warehouse
Lab 46: Analyze data with Apache Spark
Apache Spark in Microsoft Fabric provides a powerful, distributed data processing engine that allows you to perform large-scale data analysis. By using Spark, you can process structured, semi-structured, and unstructured data efficiently across multiple nodes, enabling real-time data analytics.

With Spark’s support for Python, SQL, and Scala, users can apply complex transformations, aggregations, and machine learning models on their data. In Microsoft Fabric, you can leverage Spark clusters to analyze data stored in Azure Data Lake, Blob Storage, or SQL databases, providing a scalable solution for big data analytics. Spark’s integration with other Microsoft services, such as Power BI for visualization, enhances its ability to deliver insights from large datasets in a seamless manner.
Lab 47: Explore Real-Time Intelligence in Fabric
Real-Time Intelligence in Microsoft Fabric enables you to process and analyze data as it arrives, providing instantaneous insights and actionable intelligence. In this lab, you will explore how to implement real-time data pipelines using Azure Synapse Analytics, Apache Spark, and Azure Stream Analytics within Microsoft Fabric. You will learn how to set up real-time data ingestion from various sources, such as IoT devices, logs, and event streams, and apply transformations in real-time.

With real-time intelligence, you can detect patterns, perform live analytics, and take immediate actions based on data, enabling businesses to respond quickly to changing conditions. This capability helps organizations leverage continuous data flows for timely decision-making and operational efficiency.
Lab 48: Use delta tables in Apache Spark
Delta tables in Apache Spark provide an optimized, reliable, and scalable solution for managing large datasets with ACID (Atomicity, Consistency, Isolation, Durability) properties. In this lab, you will learn how to create, query, and manage Delta tables in Apache Spark within Microsoft Fabric. You will explore how Delta tables offer features such as schema enforcement, time travel (version history), and incremental data processing.

By using Delta tables, you can efficiently handle large-scale data transformations, enabling fast data retrieval and updates. You will also learn how to perform merge operations, manage data versioning, and leverage Spark SQL to interact with the data. Delta tables make it easier to build robust, scalable data pipelines in Spark, ensuring data consistency and improving performance.
Lab 49: Organize your Fabric lakehouse using a medallion architecture
In this lab, you will learn how to implement the medallion architecture in Microsoft Fabric for organizing your lakehouse into three layers: Bronze, Silver, and Gold.
- Bronze: Raw, untransformed data.
- Silver: Cleaned and transformed data ready for analysis.
- Gold: Curated and aggregated data for reporting and business intelligence.

This architecture helps streamline data processing, improve data quality, and optimize workflows by structuring your data at different stages, ensuring efficient and scalable management of your lakehouse.
Lab 50: Ingest real-time data with Eventstreams in Microsoft Fabric
In this lab, you will learn how to ingest real-time data using Eventstreams in Microsoft Fabric. Eventstreams enable continuous data ingestion from various sources, such as IoT devices, logs, and event hubs. You will explore how to configure event stream pipelines to capture, process, and transform live data in real-time.
![]()
By using Eventstreams, you can monitor and analyze data as it is generated, enabling faster decision-making and immediate insights. This feature is ideal for scenarios requiring real-time analytics, such as anomaly detection or live monitoring.
Lab 51: Work with data in a Microsoft Fabric Eventhouse
In this lab, you will learn how to work with data in a Microsoft Fabric Eventhouse, which is optimized for handling real-time event data. You will explore how to ingest, store, and process event-driven data streams from various sources such as IoT devices, logs, and APIs.

By using an Eventhouse, you can perform real-time data transformations, filtering, and aggregation to analyze incoming event data. This setup enables you to build scalable, event-driven data pipelines that can provide immediate insights and facilitate quick decision-making based on live data.
Lab 52: Implement deployment pipelines in Microsoft Fabric
In this lab, you will learn how to implement deployment pipelines in Microsoft Fabric to automate the process of moving data and applications from development to production environments. You will explore how to set up CI/CD (Continuous Integration/Continuous Deployment) workflows to streamline the deployment of dataflows, notebooks, and semantic models.

This includes version control, automated testing, and monitoring of the deployment process to ensure smooth and consistent application updates. By using deployment pipelines, you can improve collaboration, reduce errors, and accelerate the release of data-driven solutions in a secure and efficient manner.
Related Reading: Microsoft Certified: Fabric Data Engineer | DP-700 | Step By Step Activity Guides (Hands-On Labs)
1.6 Azure Data Analyst [PL-300]
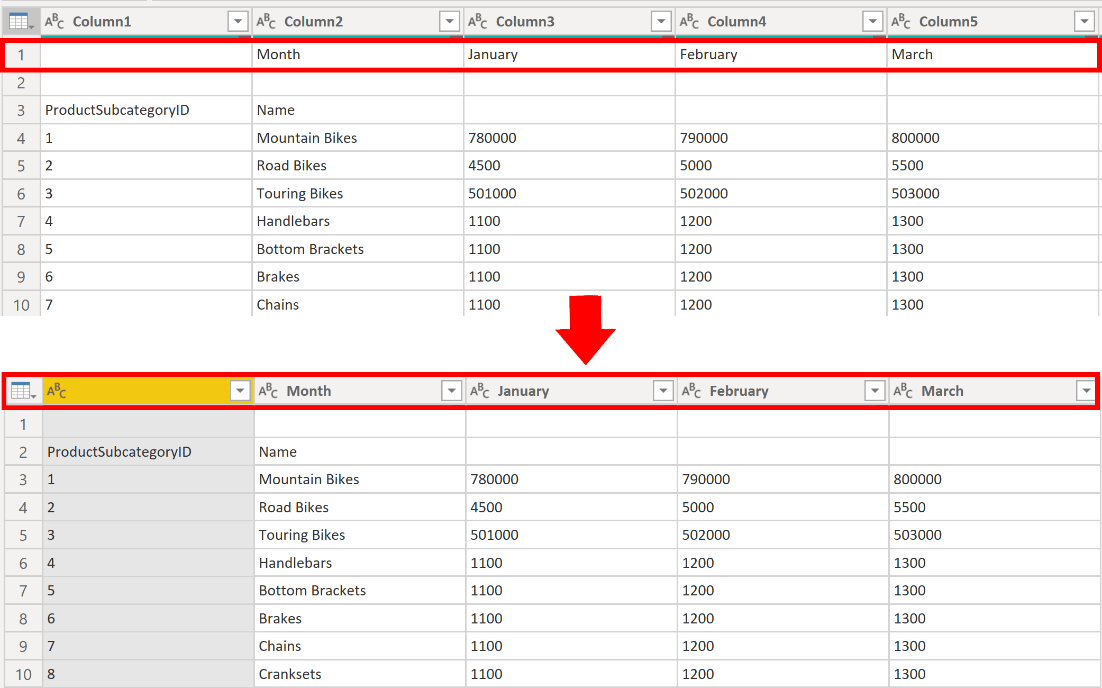
Lab 53- Prepare Data In Power BI Desktop
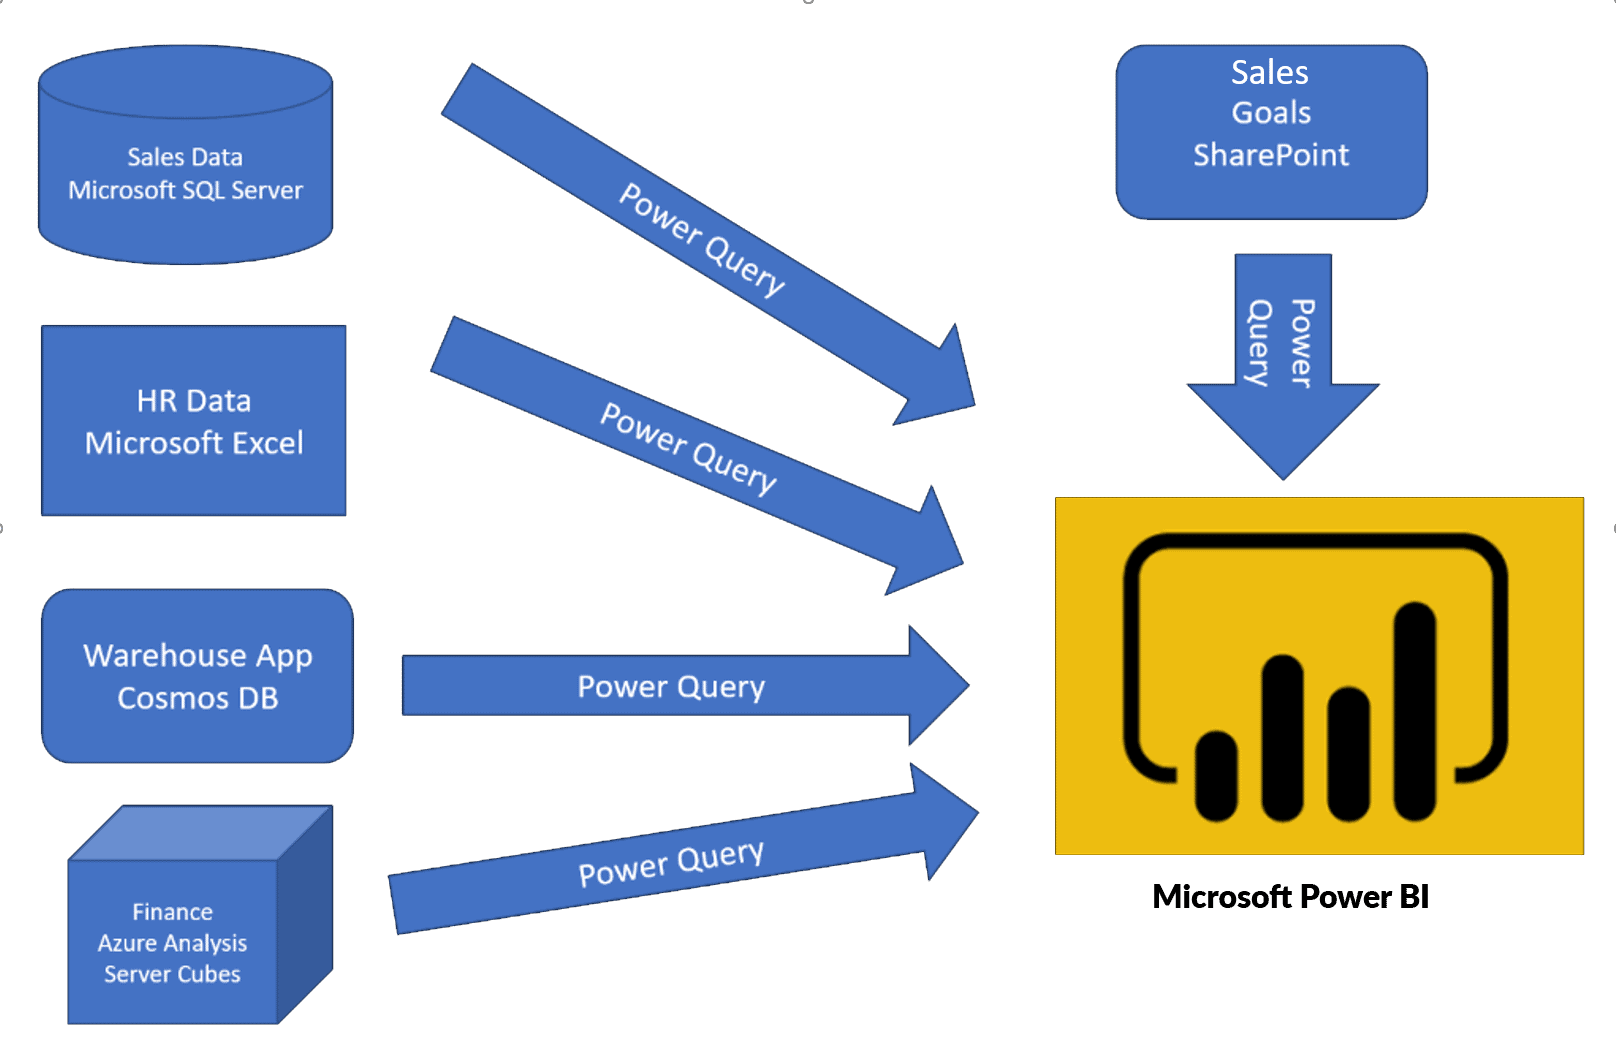
Before you will create reports in Power BI, you first need to first extract data from the data sources. Power BI Desktop allows you to get data from different types of files. When you click on the Get data feature in Power BI then you can find a list of the available options from where you can import your data.
In this lab, we will focus on the first step, of getting the data from the many different data sources and importing it into Power BI by using Power Query.
Lab 54 – Load Data In Power BI Desktop
Consider the scenario where you’ve got imported data into Power BI from several different sources and, when you examine the loaded data, it is not well prepared for analysis. What could make the data unprepared for analysis?
Power BI and Power Query come with a powerful environment to clean the raw data and prepare the data. In this lab, you will learn how to transform raw data with Power Query Editor in Power BI Desktop.
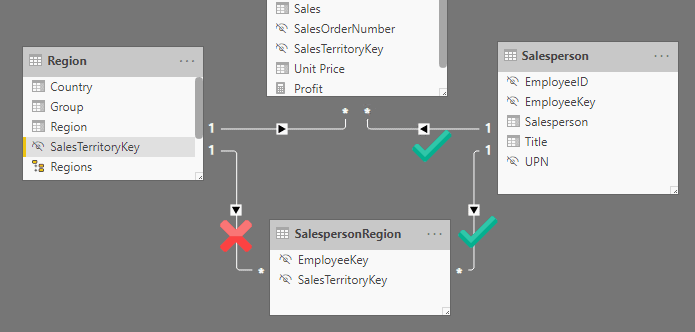
Lab 55 – Model Data In Power BI Desktop
In this lab, you’ll initiate developing the data model. It’ll involve creating relationships between tables, and then configuring table and column properties to enhance the friendliness and usability of the data model. You’ll also create hierarchies and create quick measures.
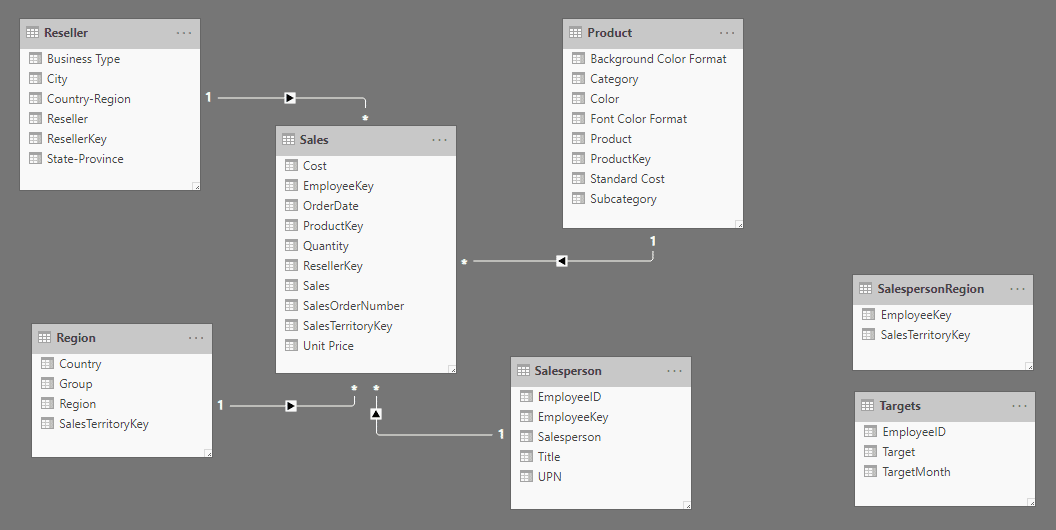
In this lab, you’ll create a many-to-many relationship between the Sales table and the Salesperson table. You’ll also implement row-level security to secure that a salesperson can only analyze sales data for their assigned region(s).
lab 56 – Create DAX Calculations In Power BI Desktop, Part 1
DAX [Data Analysis Expressions] is a programming language that is used throughout Power BI for creating calculated columns, measures, and custom tables. It is a collection of operators, functions, and constants that can be used in an expression, or formula, to calculate and return one or more values.
In this lab, you’ll create calculated columns, calculated tables, and simple measures using Data Analysis Expressions (DAX).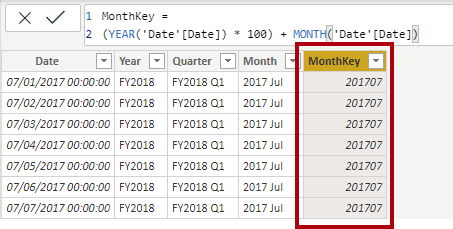
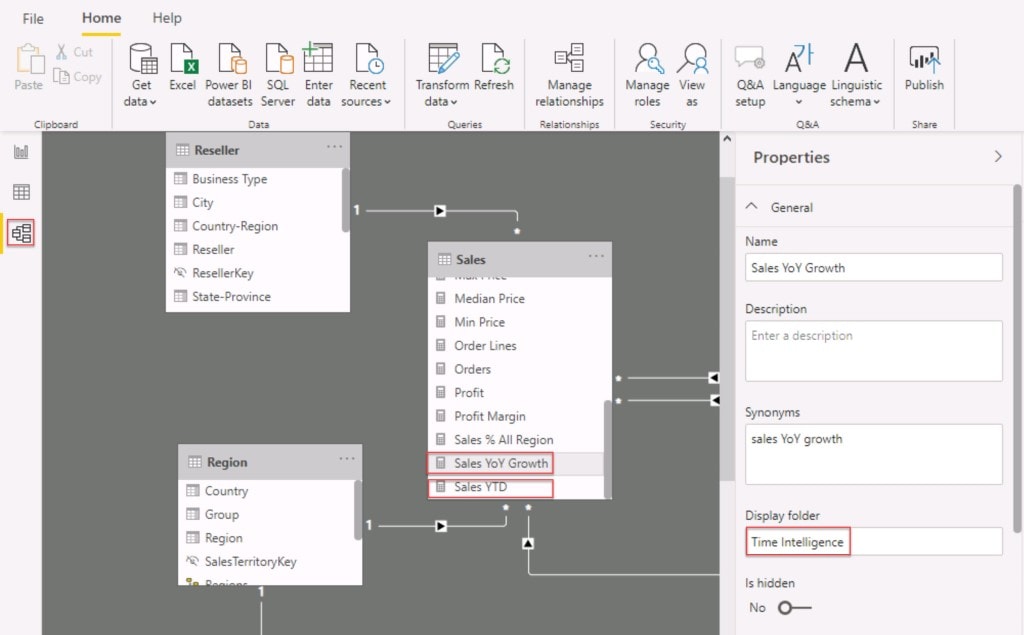
lab 57 – Create DAX calculations In Power BI Desktop, Part 2
In this lab, you’ll create measures with Data Analysis Expressions involving filter context manipulation and you’ll use Time Intelligence functions.
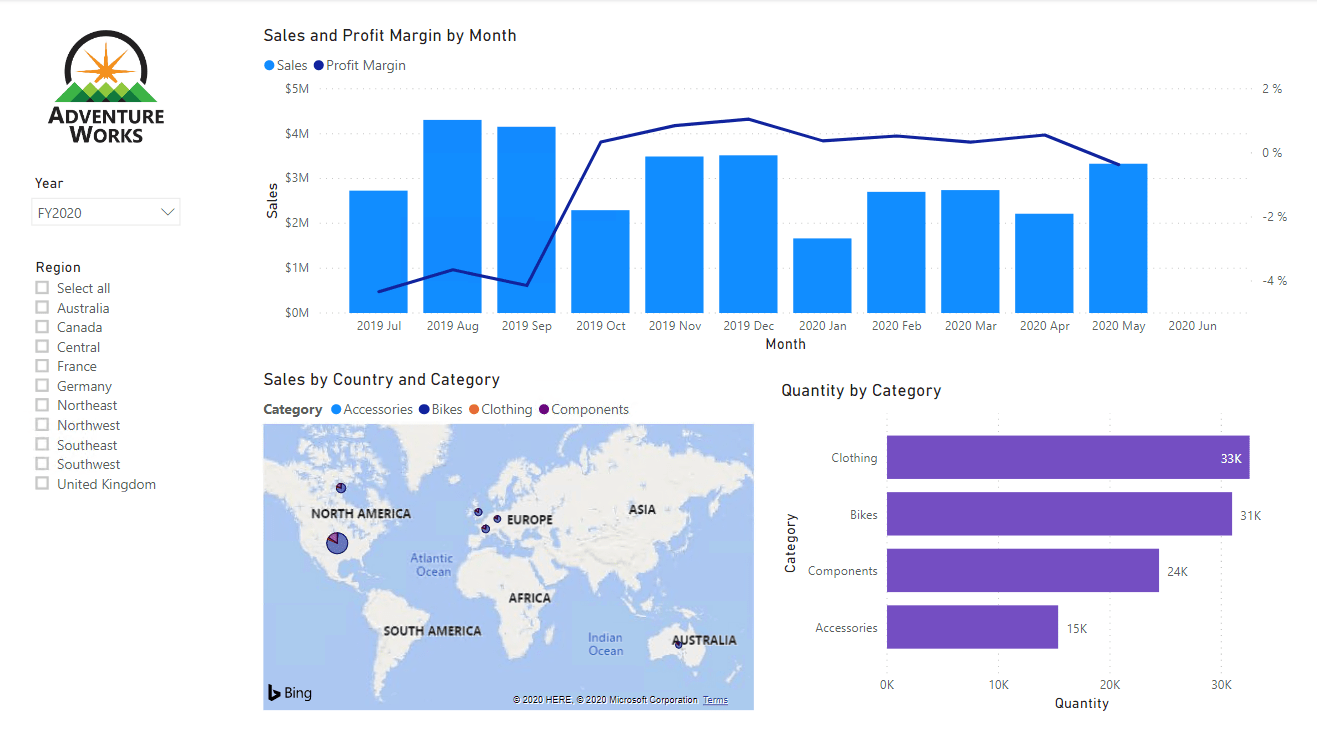
Lab 58 – Design A Report In Power BI Desktop – Part 1
Power BI visuals are attractive graphics and charts that you can use to modernize your data. Visuals allow you to share data intuition more effectively and increase retention, comprehension, and appeal. After you’ve loaded your data and modeled it in Power BI Desktop, you will be ready to start creating your reports.
In this lab, you’ll create a three-page report and then you’ll publish it to Power BI, where you can easily open and interact with the report.
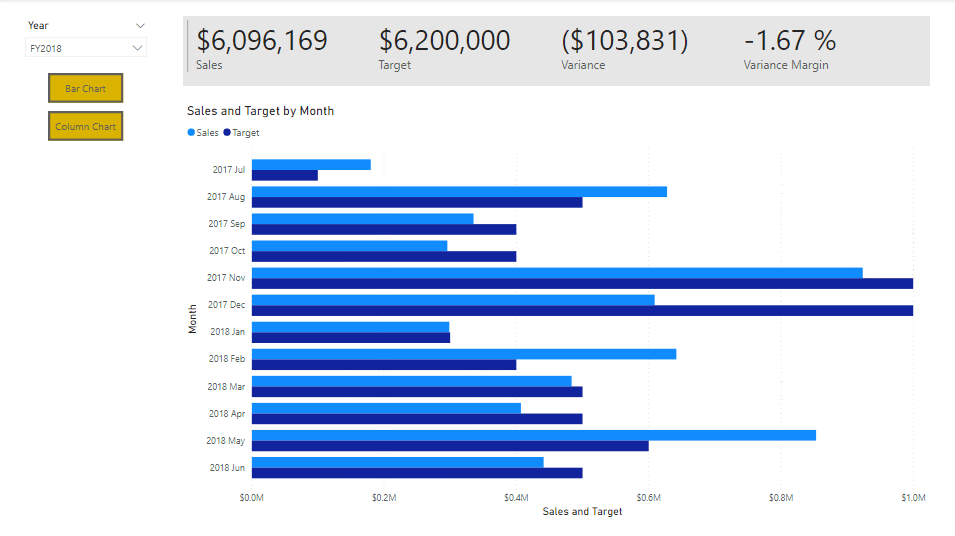
lab 59 – Design A Report In Power BI Desktop, Part 2
In this lab, you’ll enhance the Sales Analysis with advanced interactions and drill through features. You’ll learn how to work with Sync slicers and Drill through features. You’ll also Add bookmarks and buttons to your reports.
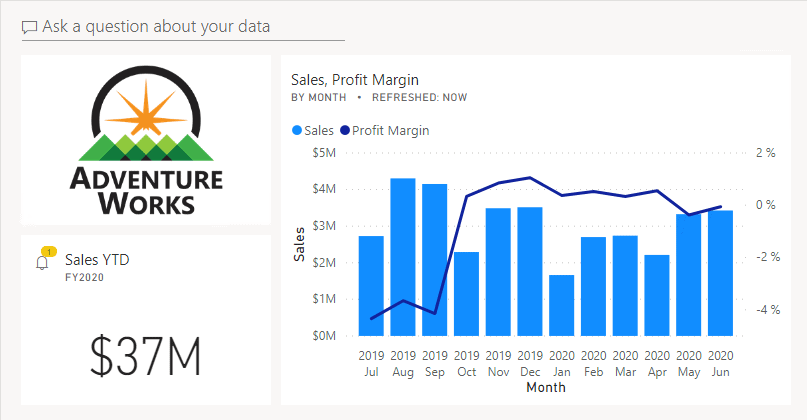
lab 60 – Create A Power BI Dashboard
Power BI reports and Power BI dashboards are not the same. Dashboards allow report consumers to create a single output of directed data that is personalized just for them.
Dashboards can be composed of pinned visuals that are taken from different reports. Where a report uses data from a single dataset and a dashboard can contain visuals from many different datasets.
In this lab, you’ll create the Sales Monitoring dashboard.
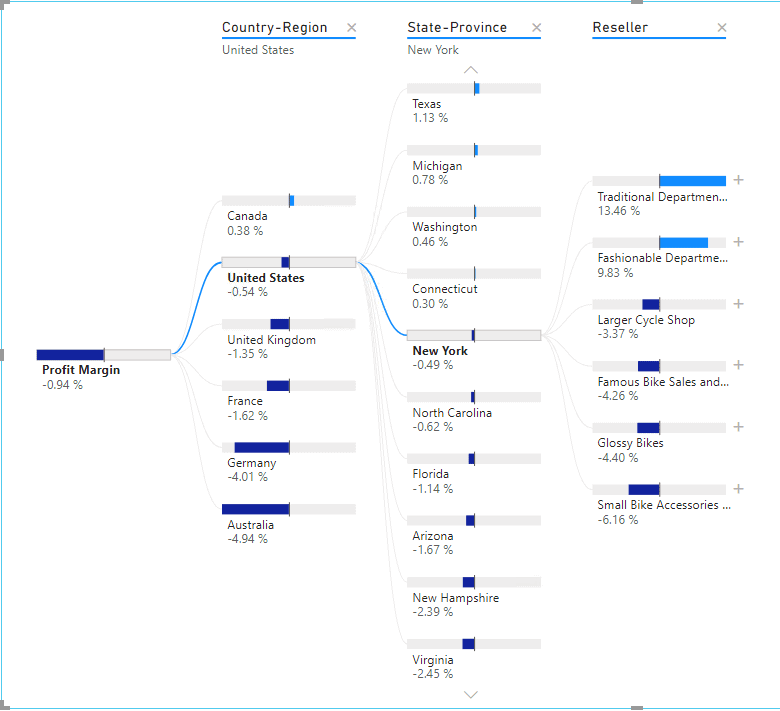
Lab 61 – Perform Data Analysis In Power BI Desktop
In this lab, you’ll use the AI aspect of the advanced analytic capabilities of Power BI to enhance your reports in good ways. In this lab, you’ll create a forecast to determine possible future sales revenue. You’ll create a decomposition tree and using the Key influencers AI visual to determine what influences profitability.
Lab 62 – Enforce Row-level Security
In this lab, you will enforce row-level security to ensure a salesperson can only ever see sales made in their assigned region(s). For example : you will enforce row-level security to ensure a salesperson can only see sales made in their assigned region.
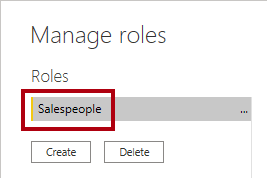
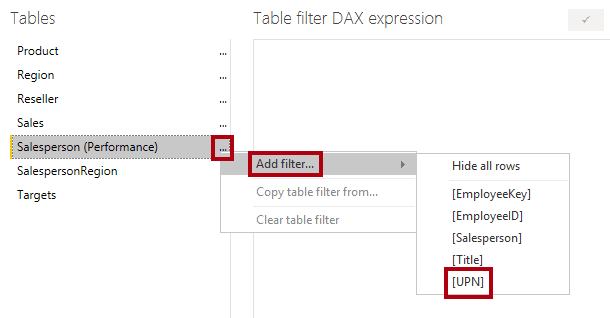
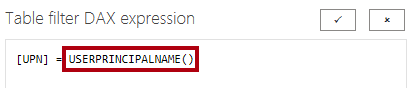
USERPRINCIPALNAME() is a Data Analysis Expressions (DAX) function that returns the name of the authenticated user. It means that the Salesperson (Performance) table will filter by the User Principal Name (UPN) of the user querying the model.
This is the list of activity guides/hands-on required for the preparation of the PL-300 Microsoft Power BI Data Analyst Exam.
Related Reading: Microsoft Power BI Data Analyst Associate [PL-300] Step By Step Activity Guides (Hands-On Labs) & Project
1.6 DP-600 [Microsoft Fabrics Analytics Engineer]
1.6.2 : Get started with Data warehouse
Lab 63: Analyze data in a data warehouse
In Microsoft Fabric, analyzing data in a data warehouse involves querying structured data to derive insights and make data-driven decisions. In this lab, you will learn how to leverage Azure Synapse Analytics or Azure SQL Data Warehouse within Microsoft Fabric to perform powerful data analysis on large datasets. You will explore how to create and manage SQL-based queries, use advanced analytics functions, and optimize query performance.

The data warehouse enables you to run complex queries and aggregations efficiently, making it ideal for business intelligence tasks. By analyzing data in a data warehouse, you can uncover trends, generate reports, and create dashboards that provide valuable insights across your organization.
Related Readings: Data Warehouse vs. Data Lake vs. Lakehouse: Choosing the Right Cloud Storage
Lab 64: Load Data into a Data Warehouse in Microsoft Fabric
In Microsoft Fabric, loading data into a data warehouse is a crucial step in enabling powerful analytics and reporting. In this lab, you will learn how to efficiently ingest and load data into a data warehouse using Azure Synapse Analytics or Azure SQL Data Warehouse. You will explore various methods for loading data, including batch processing, real-time streaming, and ETL (Extract, Transform, Load) pipelines.

By using data from sources like Azure Blob Storage, Azure Data Lake, or SQL databases, you can populate your data warehouse for further analysis. Once loaded, the data warehouse will be ready for complex querying, enabling business intelligence tools like Power BI to provide meaningful insights from your data.
Lab 65: Query a data warehouse in Microsoft Fabric
In Microsoft Fabric, querying a data warehouse enables you to extract valuable insights from large datasets. In this lab, you will learn how to use Azure Synapse Analytics or Azure SQL Data Warehouse to run SQL queries on structured data stored in your data warehouse. You will explore how to write T-SQL queries to filter, aggregate, and join data, enabling efficient analysis.

By using indexed tables and partitioned data, you can optimize query performance, even on large datasets. These queries can then be used to create reports, dashboards, or be integrated into other applications for decision-making. Querying a data warehouse in Fabric provides a powerful way to analyze business data and generate actionable insights.
Lab 66: Monitor a data warehouse in Microsoft Fabric
In Microsoft Fabric, monitoring a data warehouse is essential for ensuring optimal performance, identifying potential issues, and maintaining smooth operations. In this lab, you will learn how to use the Azure Synapse Studio and Azure Monitor to track and analyze the health and performance of your data warehouse. You will explore how to monitor key metrics such as query performance, resource usage, and storage consumption.

Additionally, you will learn how to set up alerts and notifications for specific performance thresholds, such as query latency or resource utilization, enabling proactive management. By monitoring your data warehouse in Fabric, you can ensure it operates efficiently and scales according to your business needs.
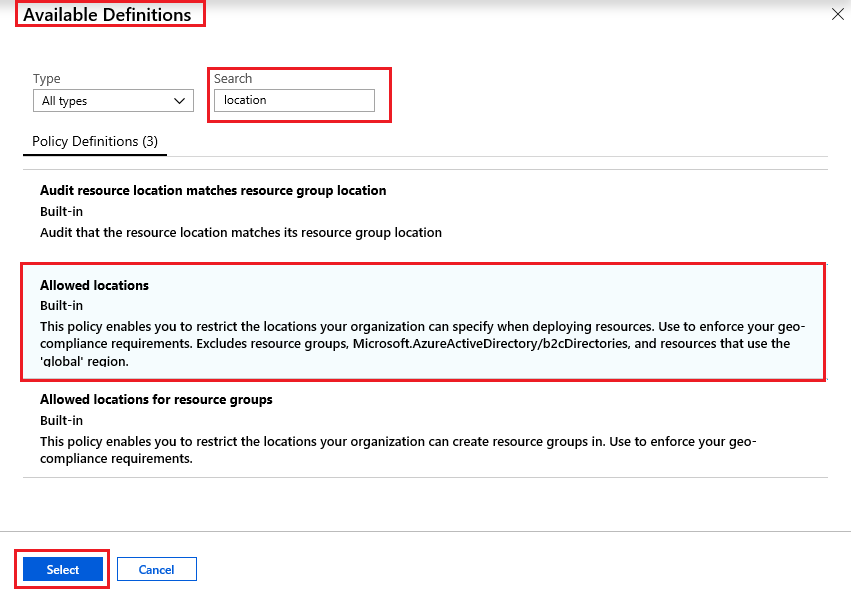
Lab 67: Secure a Microsoft Fabric data warehouse
Securing a data warehouse in Microsoft Fabric is critical to protecting sensitive data and ensuring compliance with security policies. In this lab, you will learn how to implement security best practices for Azure Synapse Analytics or Azure SQL Data Warehouse. You will explore how to configure authentication using Azure Active Directory (AAD), set up role-based access control (RBAC) to restrict user permissions, and enable firewall rules to control network access.
![]()
Additionally, you will learn how to use data encryption, both at rest and in transit, to safeguard data. By securing your data warehouse, you ensure that only authorized users can access or modify sensitive data, protecting your organization from data breaches and unauthorized access.
Lab 68: Explore data for data science with notebooks in Microsoft Fabric
In Microsoft Fabric, Notebooks provide an interactive environment for data scientists to explore, analyze, and model data. In this lab, you will learn how to use Notebooks within Microsoft Fabric to access, visualize, and manipulate data for data science projects. You will explore how to connect to various data sources, such as Azure Data Lake or SQL databases, and use languages like Python and SQL to clean, transform, and visualize data.

Notebooks in Fabric offer built-in support for machine learning models, statistical analysis, and data visualizations. By leveraging Notebooks, you can seamlessly integrate data science workflows, collaborate with team members, and build powerful predictive models directly within the Fabric environment.
1.6.3 : Work with semantic models in Microsoft Fabric
Lab 69: Create DAX calculations in Power BI Desktop
DAX (Data Analysis Expressions) is a powerful formula language used in Power BI Desktop for creating custom calculations, measures, and calculated columns. In this lab, you will learn how to use DAX to perform complex calculations on your data. You will explore how to create calculated columns, measures, and aggregates to analyze data in real-time.

Through DAX, you can create business logic such as year-to-date, percentage growth, or average calculations to enhance your Power BI reports. By mastering DAX, you will be able to build dynamic reports and dashboards that provide deeper insights, helping users to make informed decisions based on custom metrics and calculations tailored to your business needs.
Lab 70: Design scalable semantic models
In Microsoft Fabric, designing scalable semantic models enables users to define business logic and structure data in a way that makes it easier to analyze and visualize. In this lab, you will learn how to design semantic models that can handle large datasets while maintaining performance and flexibility. You will explore how to use Azure Synapse Analytics or Power BI Desktop to create semantic models that represent your business’s data relationships.

This includes defining measures, dimensions, and hierarchies. You will also learn how to use DirectQuery and import modes for optimizing performance and scalability. By designing effective semantic models, you can ensure that your data is organized, accessible, and ready for analysis, enabling faster insights across your organization.
Lab 71: Create reusable Power BI assets
Creating reusable Power BI assets allows you to streamline the development of reports, dashboards, and datasets across your organization. In this lab, you will learn how to design and create Power BI assets such as templates, themes, measures, and datasets that can be reused across multiple reports and projects. By defining shared datasets and creating template apps, you enable consistency and save time when building new reports.

You will also explore best practices for parameterization and deployment, making your Power BI assets more flexible and scalable. Reusable Power BI assets ensure a unified approach to reporting, improve collaboration, and reduce redundancy, making it easier for teams to deliver insights faster.
Lab 72: Enforce semantic model security
Enforcing semantic model security in Microsoft Fabric ensures that sensitive data within your semantic models is accessible only to authorized users. In this lab, you will learn how to implement row-level security (RLS) and object-level security (OLS) within your Power BI semantic models to restrict access based on user roles or attributes.

You will explore how to define security roles and apply dynamic security filters using DAX expressions. Additionally, you will learn how to configure permissions for different users to control access to specific data or visuals. By enforcing security at the semantic model level, you ensure that data governance policies are respected, and sensitive information is protected while providing users with personalized data insights.
1.6.4: Administer and govern Microsoft Fabric
Lab 73: Get Started with Real-Time Intelligence in Microsoft Fabric
Real-Time Intelligence in Microsoft Fabric enables the processing and analysis of data as it is generated, allowing organizations to make timely, data-driven decisions. In this lab, you will explore how to ingest and analyze real-time data using services like Azure Stream Analytics and Apache Spark Streaming integrated into Microsoft Fabric. You will learn how to set up a real-time data pipeline, configure stream processing for continuous data ingestion, and apply transformations on the fly.

By leveraging real-time intelligence, you can gain immediate insights from sources such as IoT devices, logs, or social media feeds. This capability allows for real-time alerts, anomaly detection, and instant reporting, enabling businesses to react quickly to changing conditions and improve operational efficiency.
Lab 74: Secure data access in Microsoft Fabric
Securing data access in Microsoft Fabric is essential for protecting sensitive information and ensuring that only authorized users can access and manipulate data. In this lab, you will learn how to implement security controls such as Role-Based Access Control (RBAC), Entra ID authentication, and data encryption to secure data access within Microsoft Fabric.

You will explore how to configure data access policies to control who can view or modify data in Azure Data Lake, SQL Databases, and Power BI. Additionally, you will learn how to apply row-level security (RLS) to ensure that users only see data relevant to them. By securing data access, you can safeguard your organization’s data assets and ensure compliance with security and privacy regulations.
Related Reading: Microsoft Certified: Fabric Analytics Engineer | DP-600 | Step By Step Activity Guides (Hands-On Labs)
2. Real-Time Projects
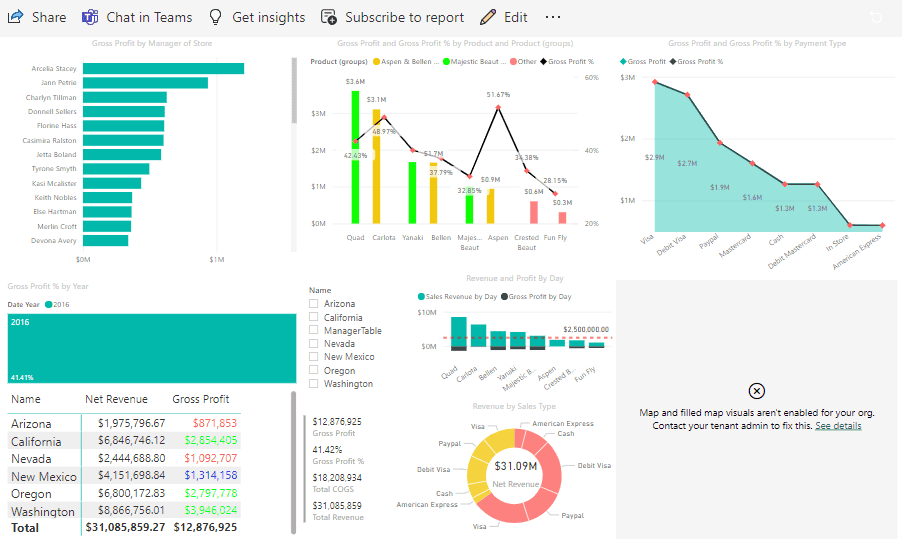
Project 1. Design a dashboard with a basic set of visualizations and DAX queries:
In a rapidly evolving marketing landscape, Company’s bold approach to data management sets them apart as a forward-thinking industry player. By implementing a powerful business intelligence solution, Company aims to streamline its operations, enhance decision-making capabilities, and maintain its competitive advantage. With complete insights into inventory, performance metrics, competitor activities, and other critical data, the Company is well-equipped to navigate the challenges of the marketing industry and drive its business forward into a prosperous future.
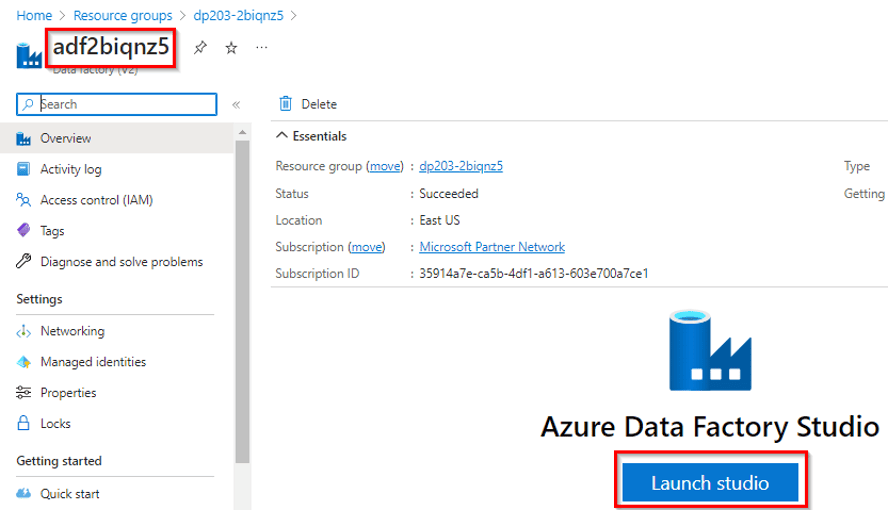
Project 2. Transform Data by Using Azure Data Factory:
You are a Data Engineer with Hexelo. You need to provision a new Azure Data Factory that supports a data pipeline that will transform data. First, you will design a batch processing solution, and then you will add directories to a storage account that uses a Data Lake Storage hierarchical namespace. Next, you will deploy an Azure Data Factory, and then you will create a data pipeline. Finally, you will author a copy data activity that will transform data into a blob data file, and then you will test and publish the data pipeline.

Project 3. Tokyo Olympics Insights:
As data engineers, we are expected to convert this raw data into information that can be interpreted by data scientists and business analysts. We need to create a power BI report that will help us gain insights about details such as:
- Gender distribution across various Olympic disciplines
- Medals distribution across the countries
- Discipline distribution across the countries

Project 4. End-to-end Azure data engineering Project in the Formula One dataset
In this project, we will utilize the Formula One (F1) dataset, which is available via the Ergast API. The dataset can be accessed in various formats such as JSON, XML, or CSV. Our goal is to leverage Azure Data Factory (ADF) to automate the process of reading F1 data directly from the Ergast API (in JSON format) and writing it to Azure SQL Database or Azure Data Lake for further processing and analysis.
-
Access the Ergast API:
-
Use Azure Data Factory to connect to the Ergast API and pull real-time F1 data in JSON format.
-
-
Data Transformation:
-
Perform necessary transformations on the raw data, such as data cleansing, parsing, and restructuring, using Azure Data Factory’s data flow capabilities.
-
-
Data Storage:
-
Write the processed data to Azure SQL Database or Azure Data Lake for storage and further analysis.
-
-
Automation:
-
Set up an automated pipeline within Azure Data Factory to periodically fetch and update F1 data from the Ergast API to ensure data freshness.
-

Project 5. Analyse the Streaming Transportation Data
This project aims to analyze real-time transportation data from various regions, ethnicities, and transport modes. The process involves using Python to read the data from a CSV file, send it to Azure Event Hub for real-time streaming, and then transforming the data into actionable insights using Power BI. Additionally, we’ll explore the role of SQL databases in stream analytics for storing and querying the data efficiently.

Project 6. COVID-19 Data Insights using ADF & Power BI
The project analyzes the spread and impact of Covid-19 in Europe in 2020 using datasets from the ECDC. It employs cloud tools like Azure Data Factory, HDInsight, and Databricks for data ingestion, cleaning, and transformation. Key metrics such as confirmed cases, death rates, and testing statistics are stored in a SQL Data Warehouse, enabling the analytics team to generate insights and predictive models for effective pandemic management.

Project 7. Toys Sales Revenue Analysis
The Toy Sales Revenue Analysis project focuses on examining the sales data of toy products to uncover valuable insights that can help improve business strategies. This analysis leverages Power BI, a powerful Business Intelligence (BI) tool, to transform raw sales data into visually appealing and actionable insights.

The primary goal of this project is to evaluate toy sales performance across multiple dimensions, such as product categories, sales channels, regions, and time periods. By analyzing these factors, the project aims to identify key trends, revenue drivers, and potential areas for business growth.
3. Certifications
1. Azure Fundamentals (AZ-900)
This entry-level certification is designed for those who are new to Azure and cloud computing. It covers the core services, cloud concepts, Azure pricing, and governance principles. Ideal for beginners or those aiming to validate foundational knowledge in Azure services and cloud technologies before progressing to more specialized Azure certifications.

Related Readings: Exam AZ-900: Microsoft Azure Fundamentals Certification
<h3id=”dp900″>2. Azure Data Fundamentals (DP-900)
The Azure Data Fundamentals (DP-900) certification focuses on core Azure data services, covering both relational and non-relational data on Azure, and is perfect for beginners seeking to understand Azure’s data solutions. This certification is a great starting point for individuals aiming to work with data on the Azure platform.

Related Readings: Exam DP-900: Microsoft Azure Data Fundamentals Certification
3. Microsoft Fabric Data Engineer (DP-700)
For professionals working with Microsoft Fabric, the Microsoft Fabric Data Engineer (DP-700) certification is a comprehensive exam focused on data storage, processing, and architecture within Microsoft Fabric. This certification is aimed at data engineers looking to specialize in this platform, equipping them with the necessary skills to design and implement scalable data solutions.

Related Readings: Exam DP-700: Microsoft Fabric Data Engineer Certification
4. Microsoft Fabric Data Analytics (DP-600)
Similarly, the Microsoft Fabric Data Analytics (DP-600) certification is tailored for data analysts seeking to design and implement data solutions using Microsoft Fabric for data analysis. This certification is essential for those interested in data analytics and looking to build expertise in this area.

Related Readings: Exam DP-600: Microsoft Fabric Data Analytics Engineer Certification
5. Power BI Data Analyst (PL-300)
The Power BI Data Analyst (PL-300) certification is targeted at individuals who wish to master Power BI, focusing on data visualization, modeling, and transformation to create insightful reports. This certification is essential for data analysts aiming to work with Power BI, helping them develop the skills needed to provide business intelligence solutions.

Related Readings: Exam PL-300: Microsoft Power BI Data Analyst Certification
6. Azure Database Administrator Associate (DP-300)
Lastly, the Azure Database Administrator Associate (DP-300) certification is for database administrators who want to deepen their knowledge in managing Azure databases. This certification covers tasks such as security, performance monitoring, and high availability, making it ideal for professionals responsible for managing database environments in Azure.

Related Readings: Exam DP-3000: Microsoft Azure Database Administrator Associate
Next Task For You
In our Azure Data on Cloud Job-Oriented training program, we will cover 70+ Hands-On Labs. If you want to begin your journey towards becoming a Microsoft Certified Associate and Get High-Paying Jobs check out our FREE CLASS.
![Microsoft Agentic AI Business Solutions Architect [AB-100] | K21 Academy](https://test.k21academy.com/wp-content/uploads/2025/11/Microsoft-Agentic-AI-Business-Solutions-Architect-AB-100-Exam-Overview1.png)