
![]()

This blog post is your gateway to mastering ML & Data Using Python – a skill set in high demand across industries. Dive into our 25+ Hands-On Labs and 5 Real-Time Projects, meticulously crafted to not only enhance your expertise but also supercharge your CV and prepare you for a thriving career.
Learn the tools and techniques employers seek, build an impressive portfolio, and ace job interviews with confidence. Whether you’re an aspiring Data Scientist, Machine Learning Engineer, or AI Developer, these resources will equip you to stand out and succeed. Your journey to a rewarding career in the exciting fields of Artificial Intelligence, Machine Learning, and Data Science starts here!
Table of Contents:
1. Hands-On Labs for ML & Data Using Python
1.1 Introduction to Python for Machine Learning
- Lab 1: Installing Python: Windows, Mac, Linux, AnyOS
- Lab 2: Install & Use Jupyter Notebook
- Lab 3: Basics- Variables, data types, operations
1.2 Python Data Structures, Control, and Functions (Basics)
- Lab 4: Data Structures(Tuples, List, Dictionary)
- Lab 5: Control Statements
- Lab 6: Function Arguments and Class Objects
- Lab 7: Central Tendency
- Lab 8: Data Visualization
- Lab 9: OOP Hands-on
1.4 Introducing Machine Learning & Packages
- Lab 10: Working with Numpy
- Lab 11: Working with Pandas
- Lab 12: SkLearn- Build ML Classification Model
1.5 Exploratory Data Analysis (EDA) & Feature Engineering
- Lab 13: Feature Engineering
- Lab 14: Dimensionality Reduction
1.6 Supervised Machine Learning
- Lab 15: Supervised Machine Learning
- Lab 16: Model Evaluation
- Lab 17: Ensemble Learning
1.8 Unsupervised Machine Learning
- Lab 18: K-Means Clustering Analysis
- Lab 19: Mall Customer Segmentation Using K-means
- Lab 20: Association Rule Mining
- Lab 21: Frequent Pattern Growth.
1.9 Model Optimization Techniques
- Lab 22: Hyperparameter Tuning
- Lab 23: Classification with Regularization
- Lab 24: L1 and L2 Regularization
- Lab 25: K-Fold Cross-Validation
- Lab 26: t-SNE
1.10 Introduction to Neural Networks, DL & TSA
- Lab 27: Bombay Surface Temperature Forecasting Using Time Series Analysis and LSTM
- Project 1: House Price Prediction Using Python
- Project 2: Grouping of Similar Types of Patients
- Project 3: Bank Term Deposit Subscription
- Project 4: Bank Customer Churn Model
- Project 5: Bitcoin Price Prediction
1. Hands-On Labs For ML & Data Using Python
1.1 Introduction to Python for Machine Learning
Lab 1: Installing Python: Windows, Mac, Linux, AnyOS
In this lab, you’ll start by installing Python, the programming language that powers many data science, machine learning, and automation projects. You’ll learn how to download and install Python on your computer, set up a development environment, and verify the installation by running a simple Python program. This lab will provide you with the foundation to begin writing and running Python code, making it the first step in your journey into the world of programming and data analysis.
By the end of this lab, you will have Python installed and ready for running programs and packages efficiently.
Lab 2: Install & Use Jupyter Notebook
In this lab, you’ll learn how to set up and use Jupyter Notebook and Google Colab, two powerful tools for writing and running Python code in an interactive environment. Jupyter Notebook is ideal for working with data, visualizations, and documentation in one place, while Google Colab provides a cloud-based platform for running Python code without any installation. You’ll walk through setting up both platforms, creating your first notebook, and running Python code cells.

By the end of this lab, you’ll be comfortable using these tools to write, test, and share your Python projects.
Related Readings: Jupyter Notebook Tutorial
Lab 3: Basics- Variables, data types, operations
In this lab, you’ll dive into the basics of Python syntax, starting with variables, data types, and basic operations. You’ll learn how to assign values to variables, work with different data types like integers, floats, strings, and booleans, and perform basic operations like addition, subtraction, multiplication, and division. You’ll also get familiar with working with simple input and output functions.
By the end of this lab, you’ll have a solid understanding of how to work with basic Python constructs, laying the foundation for more advanced programming tasks.
1.2 Python Data Structures, Control, and Functions (Basics)
Lab 4: Data Structures(Tuples, List, Dictionary)
This lab covers the fundamental Python data structures: tuples, lists, and dictionaries. You will learn how to create, access, modify, and manipulate these data structures. The lab demonstrates their key characteristics, such as the immutability of tuples, dynamic resizing of lists, and key-value pairing in dictionaries. By completing this lab, you’ll gain practical skills to efficiently organize and manage data in Python programs.

By the end of this lab, you’ll be comfortable using lists to store and manage data in your Python programs.
Related Readings: Data Types In Python
Lab 5: Control Statements
In this lab, you’ll explore control statements in Python, which allow you to control the flow of your program. You’ll learn how to use if, else, and elif statements to make decisions based on conditions. Additionally, you’ll dive into for and while loops to repeat actions, and learn how to use break and continue to manage loop behavior. 
By the end of this lab, you’ll be able to create programs that can respond to different conditions and repeat tasks efficiently, providing more flexibility and control over your code’s execution.
Related Readings: Loops And Control Statements In Python
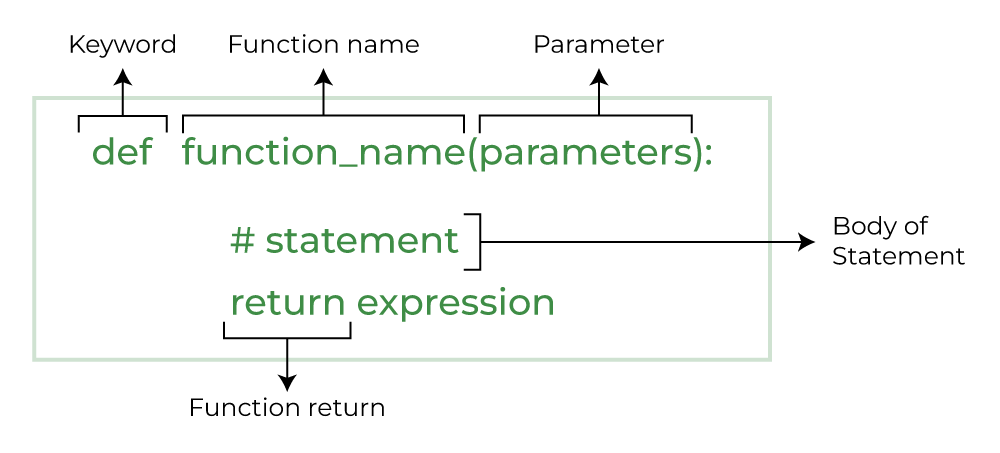
Lab 6: Function Arguments and Class Objects
In this lab, you’ll learn how to work with function arguments and class objects in Python. You’ll explore how to pass arguments to functions, including positional, keyword, and default arguments, and how to handle them within the function. Additionally, you’ll be introduced to object-oriented programming (OOP) by learning how to create classes and objects. You’ll understand how to define class attributes, methods, and the use of self to access instance variables.
By the end of this lab, you’ll have a solid foundation in both functions and classes, enabling you to structure your code more efficiently and work with more complex systems.
Related Readings: Python Functions: Overview, Types, Arguments, Doctstirng
1.3 OOP PROGRAMMING CONCEPTS
Lab 7: Central Tendency
In this lab, you will explore the concept of central tendency, a fundamental aspect of statistics that helps summarize a dataset with a single representative value. You will learn to calculate and interpret the mean, median, and mode, and understand how these measures provide insights into the distribution of data. This lab will help you gain a deeper understanding of how central tendency plays a key role in analyzing and interpreting real-world data.
Lab 8: Data Visualization
In this lab, you’ll learn how to turn data into easy-to-understand visuals like charts and graphs. You’ll work with simple tools to create things like bar charts, line graphs, and scatter plots. This will help you see patterns and trends in data more clearly, making it easier to explain your findings to others.
By the end of the lab, you’ll be able to present data in a way that’s both informative and visually appealing.
Lab 9: OOP Hands-on
In this lab, you’ll get practical experience with Python’s Object-Oriented Programming features. This lab covers creating classes and objects, implementing inheritance, and using encapsulation and polymorphism to write clean, efficient, and reusable code.
Become a Python Pro for AI & ML — Start Learning with K21 Academy!
1.4 Introducing Machine Learning & Packages
Lab 10: Working with Numpy

In this lab, you’ll get hands-on with NumPy, a powerful Python library used for working with large sets of numbers and arrays. You’ll learn how to perform calculations, manipulate data, and solve problems efficiently using NumPy’s tools. Whether you’re working with basic arithmetic or more complex mathematical operations, this lab will help you understand how to use NumPy to handle data more effectively and make your code faster and easier to work with.
Lab 11: Working with Pandas
 In this lab, you’ll explore Pandas, a popular Python library used for handling and analyzing data in tabular form (like spreadsheets or CSV files). You’ll learn how to load, clean, and manipulate data, making it easier to analyze and extract useful information. By the end of this lab, you’ll be able to use Pandas to organize, filter, and transform data efficiently, setting you up for more advanced data analysis tasks.
Lab 12: SkLearn- Build ML Classification Model

This lab guides you through building a machine-learning classification model using the Scikit-learn (SkLearn) library. You will learn how to load datasets, preprocess data, select and train a classification algorithm, and evaluate model performance using metrics like accuracy and confusion matrix. By the end of the lab, you’ll be able to create and assess a basic ML classification model in Python.
Related Readings: Python Libraries
1.5 Exploratory Data Analysis (EDA) & Feature Engineering
Lab 13: Feature Engineering
In this lab, you’ll dive into Feature Engineering, a crucial step in the machine learning pipeline that involves transforming raw data into meaningful features to improve model performance. You’ll learn techniques like handling missing values, encoding categorical variables, scaling numerical features, and creating new features based on existing data. The lab will guide you through practical examples of feature transformation and selection to enhance your models.
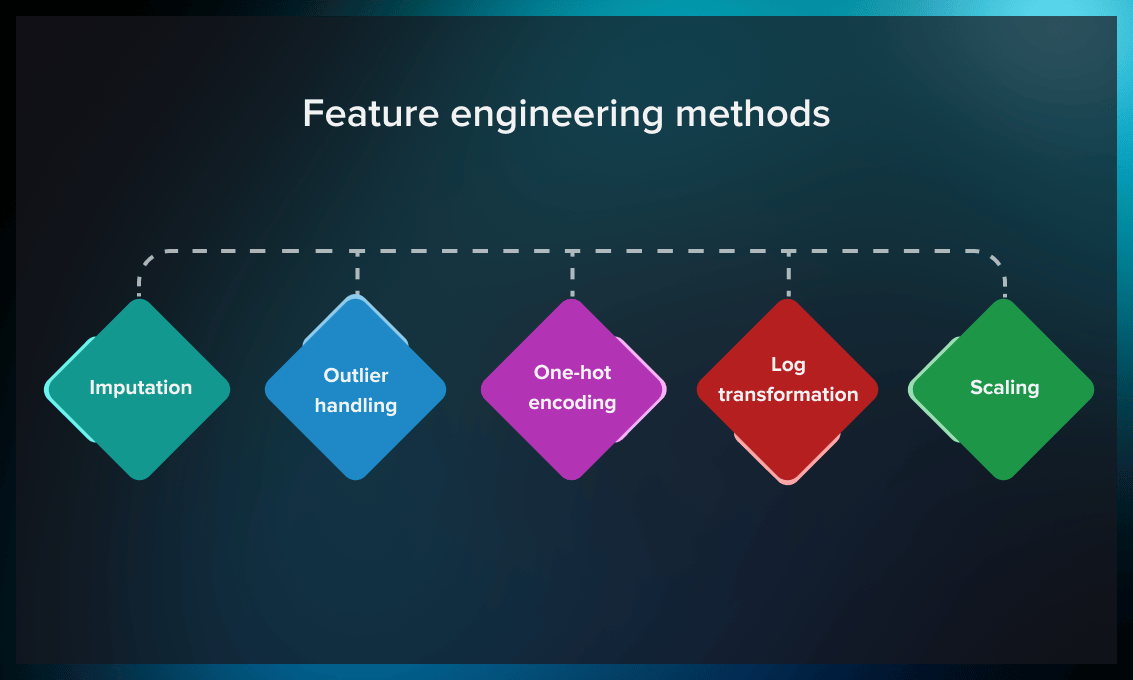
By the end of this lab, you’ll understand how to apply feature engineering techniques to optimize your machine-learning models and ensure they perform at their best.
Lab 14: Dimensionality Reduction
In this lab, you’ll learn about Dimensionality Reduction, a technique used to reduce the number of features in a dataset while retaining as much information as possible. You’ll explore methods like Principal Component Analysis (PCA) and t-SNE to simplify complex datasets and make them more manageable for machine learning models. The lab will guide you through applying these techniques, visualizing high-dimensional data, and understanding the trade-offs involved.
By the end of this lab, you’ll be able to effectively reduce dimensions in large datasets, improving both model performance and interpretability.
1.6 Supervised Machine Learning
Lab 15: Supervised Machine Learning

This lab introduces the core concepts of supervised machine learning, where models are trained on labeled data to make predictions. You will explore common algorithms like linear regression and decision trees, understand the training and testing process, and evaluate model performance. By completing this lab, you’ll gain practical experience in building and validating supervised ML models.
Lab 16: Model Evaluation
In this lab, you’ll learn about various model evaluation metrics that help assess the performance of machine learning models. You’ll explore important metrics like accuracy, precision, recall, F1-score, confusion matrix, and ROC-AUC, and understand when and why each metric is useful depending on the problem you’re solving. The lab will guide you through calculating these metrics and interpreting the results to make informed decisions about model performance.
By the end of this lab, you’ll have a solid understanding of how to evaluate and compare machine learning models to ensure they meet your desired objectives.
1.7 Ensemble Learning
Lab 17: Ensemble Learning
In this lab, you’ll learn about Ensemble Learning, a powerful technique in machine learning where multiple models are combined to improve performance. You’ll explore different ensemble methods, such as Bagging, Boosting, and Stacking, and understand how they work to make more accurate predictions by reducing bias and variance.
By the end of this lab, you’ll be able to apply these methods to create stronger, more reliable models for various data science tasks.
1.8 Unsupervised Machine Learning
Lab 18: K-Means Clustering Analysis
In this lab, you’ll explore K-Means Clustering, a popular unsupervised machine-learning algorithm used to group similar data points into clusters. You’ll learn how to choose the optimal number of clusters (K), apply the algorithm to real-world data, and interpret the results. The lab will guide you through the process of training a K-means model, visualizing clusters, and understanding the concept of centroids.
By the end of this lab, you’ll be able to use K-means clustering to find patterns and groupings in datasets, which can be useful for customer segmentation, anomaly detection, and more.
Lab 19: Mall Customer Segmentation Using K-means
In this lab, you’ll explore customer segmentation using the K-means clustering algorithm. You’ll learn how to group customers based on their purchasing behavior and demographic data. By applying K-means, you’ll be able to identify distinct customer segments, which can help businesses tailor their marketing strategies and improve customer targeting.
By the end of this lab, you’ll understand how to use K-means to gain insights from data and make data-driven decisions in customer segmentation.
Lab 20: Association Rule Mining
In this lab, you’ll learn about Association Rule Mining, a technique used to discover interesting relationships or patterns between items in large datasets. Often used in market basket analysis, this method helps identify which products are frequently bought together. You’ll explore how to apply algorithms like the Apriori algorithm to find these associations, and how to interpret the results to uncover valuable insights.
By the end of this lab, you’ll be equipped to use Association Rule Mining for tasks like recommendation systems and data-driven decision-making.
Lab 21: Frequent Pattern Growth
In this lab, you’ll dive into the Frequent Pattern Growth (FP-growth) algorithm, a more efficient method for mining frequent item sets in large datasets. Unlike the Apriori algorithm, FP growth reduces the need for multiple passes over the data, making it faster and more scalable. You’ll learn how to implement FP-growth to discover patterns in transactional data, which can be used for tasks like market basket analysis.
By the end of this lab, you’ll be able to apply FP-growth to uncover frequent patterns and use them to derive actionable insights.
1.9 Model Optimization Techniques
Lab 22: Hyperparameter Tuning
In this lab, you’ll learn about Hyperparameter Tuning, an essential step in optimizing machine-learning models. You’ll explore how hyperparameters—such as learning rate, tree depth, and regularization strength—can significantly impact model performance. The lab will guide you through techniques like Grid Search and Random Search to systematically explore different combinations of hyperparameters and find the best ones for your model.
 By the end of this lab, you’ll be able to fine-tune your models to achieve better accuracy, speed, and generalization.
Lab 23: Classification with Regularization
This lab covers classification techniques enhanced with regularization methods like Lasso and Ridge to prevent overfitting. You will learn how to apply regularization to improve model generalization, tune hyperparameters, and evaluate the impact on classification performance. By completing this lab, you’ll understand how to build more robust and reliable classification models.
Lab 24: L1 and L2 Regularization
This lab focuses on L1 (Lasso) and L2 (Ridge) regularization techniques used to reduce overfitting in machine learning models. You will learn how each method works, their effects on model coefficients, and how to apply them to improve model performance and interpretability. By the end of the lab, you’ll be able to implement and tune L1 and L2 regularization in your ML workflows.
Lab 25: K-Fold Cross-Validation
This lab introduces K-Fold Cross-Validation, a technique to assess machine learning model performance more reliably by splitting data into multiple folds. You will learn how to implement K-Fold validation to train and test models on different subsets, helping reduce bias and variance in evaluation. By completing this lab, you’ll be able to validate models effectively and improve their generalization.
Lab 26: t-SNE
In this lab, you’ll explore t-SNE (t-Distributed Stochastic Neighbor Embedding), a powerful dimensionality reduction technique used for visualizing high-dimensional data. t-SNE helps map complex data, such as clusters or relationships between variables, into a lower-dimensional space, often two or three dimensions, for easier interpretation. You’ll learn how to apply t-SNE to datasets and visualize patterns or groupings that may not be immediately obvious in higher-dimensional data.
By the end of this lab, you’ll be able to use t-SNE to create insightful visualizations that make complex data more understandable.
1.10 Introduction to Neural Networks, DL & TSA
Lab 27: Bombay Surface Temperature Forecasting Using Time Series Analysis and LSTM
In this lab, you will learn how to analyze and forecast surface temperature data for Bombay using time series techniques. The focus is on preparing and exploring the temperature dataset, applying Long Short-Term Memory (LSTM) neural networks to capture temporal patterns, and building a predictive model for accurate future temperature forecasting.
This hands-on lab emphasizes deep learning for time-dependent data and practical implementation of LSTM in Python.
2. Real-time Projects
Project 1: House Price Prediction Using Python
Scenario:
You are working as a Data Scientist at ABC Realty Analytics, a company specializing in real estate insights. The team is building a predictive analytics tool to estimate house prices based on various features such as location, size, number of rooms, and amenities. This tool aims to help realtors and buyers make informed decisions.

Description:
In this project, you will:
- Understand the Problem Statement: Learn how predictive modeling can help estimate house prices based on historical data.
- Prepare the Dataset: Work with a dataset containing features like square footage, number of bedrooms, locality, and more. Clean and preprocess the data to handle missing values and outliers.
- Build the Prediction Model: Train a regression model using algorithms such as Linear Regression, Random Forest, or XGBoost to predict house prices.
- Evaluate Model Performance: Use metrics such as Mean Absolute Error (MAE) and Root Mean Squared Error (RMSE) to assess the model’s accuracy.
- Deploy the Model: Create a simple interface for users to input features and receive predicted prices.
Project 2: Grouping of Similar Types of Patients
Scenario:
A healthcare organization is looking to improve its patient care by understanding the different types of patients it serves. The goal is to categorize patients into distinct groups based on their health conditions and characteristics. By identifying similarities between patients, the organization hopes to offer more personalized treatment plans, improve resource allocation, and enhance overall care.

Description:
In this project, you’ll work with a dataset containing various patient attributes, such as age, medical history, diagnoses, and treatment outcomes. Using clustering algorithms like K-means or hierarchical clustering, you’ll group patients with similar characteristics into categories. This segmentation will help the healthcare organization identify patterns in the patient population, such as high-risk groups, common conditions, or treatment responses. By the end of the project, you’ll be able to provide actionable insights for healthcare providers to better target interventions, optimize treatments, and improve the overall healthcare experience for different patient types.
Project 3: Bank Term Deposit Subscription
Scenario:
A bank wants to predict which of its customers are likely to subscribe to a term deposit. By analyzing customer data, the bank aims to improve its marketing strategies and target the right customers with personalized offers. The goal is to predict the probability of a customer subscribing to a term deposit based on their demographic and financial features.
 Description:
In this project, you will work with a dataset containing customer information, including age, job type, marital status, education level, past contact information, and financial features. Using classification algorithms such as Logistic Regression, Decision Trees, or Random Forest, you will build a model that predicts whether a customer will subscribe to a term deposit or not. You’ll preprocess the data, handle missing values, and evaluate the model’s performance using accuracy and other metrics like precision, recall, and F1-score. By the end of the project, you will have a working model that the bank can use to identify potential customers for targeted marketing campaigns and improve its overall customer engagement.
Project 4: Bank Customer Churn Model
Scenario:
A bank is concerned about customer churn and wants to predict which customers are at risk of leaving. By identifying high-risk customers in advance, the bank can take proactive measures to retain them through targeted offers or personalized services. The goal is to build a model that helps predict the likelihood of a customer churning, based on their account activity and demographic information.

Description:
In this project, you’ll work with a dataset that includes customer details such as account information, age, tenure, product usage, transaction history, and service interactions. Using classification algorithms like Logistic Regression, Decision Trees, or Support Vector Machines, you’ll build a churn prediction model. The process will involve data preprocessing (handling missing values, encoding categorical variables), feature engineering, and model evaluation through accuracy, precision, recall, and F1-score. By the end of the project, you will have a predictive model that can help the bank identify at-risk customers and provide insights on how to improve customer retention strategies, ultimately reducing churn rates.
Project 5: Bitcoin Price Prediction
Scenario:
A financial firm wants to predict the future price of Bitcoin to make better investment decisions. Given the volatile nature of cryptocurrencies, accurate predictions can help the firm maximize profits and minimize risks. The goal is to build a model that forecasts Bitcoin prices based on historical data, market trends, and external factors such as news sentiment and trading volume.

Description:
In this project, you’ll work with a dataset that includes historical Bitcoin prices, along with relevant features like trading volume, market capitalization, and possibly sentiment analysis from news articles or social media. Using machine learning techniques such as Time Series Analysis, Linear Regression, or more advanced methods like Long Short-Term Memory (LSTM) networks, you will create a model that predicts Bitcoin’s future price movements. The project will involve data preprocessing (handling missing values, feature engineering, etc.), training the model, and evaluating its performance using metrics like RMSE (Root Mean Square Error) or MAE (Mean Absolute Error). By the end of this project, you’ll have a predictive model that can assist in making more informed decisions in the highly volatile cryptocurrency market.
Conclusion
In conclusion, mastering ML & Data Using Python is a powerful way to kickstart your career in the fields of AI, data science, and technology. The hands-on labs and real-time projects in this blog guide you through crucial skills such as Python programming, machine learning algorithms, and data analysis techniques. As you work through these labs, you gain practical experience that helps you build a strong foundation, giving you the confidence to tackle complex problems and develop real-world solutions.
This knowledge is not just theoretical — it translates into tangible skills that are in high demand across industries. By completing these labs and projects, you’ll be able to create an impressive portfolio that showcases your expertise, setting you apart from the competition. Whether you’re aiming for a career as a Data Scientist, Machine Learning Engineer, or AI Developer, this training will help you stand out and open up exciting opportunities in the growing world of AI and data science. Your journey to a successful career in this dynamic field starts here!
Frequently Asked Questions
What are the algorithms used in machine learning in Python?
Linear Regression, Decision Trees, Random Forest, Support Vector Machines, K-Means Clustering, and Neural Networks are some of the most widely used machine learning techniques in Python.
How is Python used in data analysis?
Python's many libraries and tools for statistical analysis, data manipulation, and visualisation make it a popular choice for data analysis. It makes it possible for data analysts to manage big datasets effectively, carry out intricate computations, and provide perceptive visualisations.
How is Python used in data visualization?
Two Python libraries used for data visualisation are Matplotlib and Seaborn. They come with built-in modules for creating various graphs. Seaborn is mainly used for statistical graphs, whereas Matplotlib is used to embed graphs into programs.

![Microsoft Agentic AI Business Solutions Architect [AB-100] | K21 Academy](https://test.k21academy.com/wp-content/uploads/2025/11/Microsoft-Agentic-AI-Business-Solutions-Architect-AB-100-Exam-Overview1.png)